In the Test Run dashboard of QLM, you can access a summary of the total number of test case executions and their status to get an overview of your testing progress. This feature enables a quick assessment of your testing efforts to identify bottlenecks or issues and make informed decisions for your testing process.
It's a powerful tool for project managers, quality assurance teams, and stakeholders to stay on top of the testing progress and ensure smooth software development cycles. Let's explore the test results page for both automated and manual tests in the Test Run Dashboard.
-
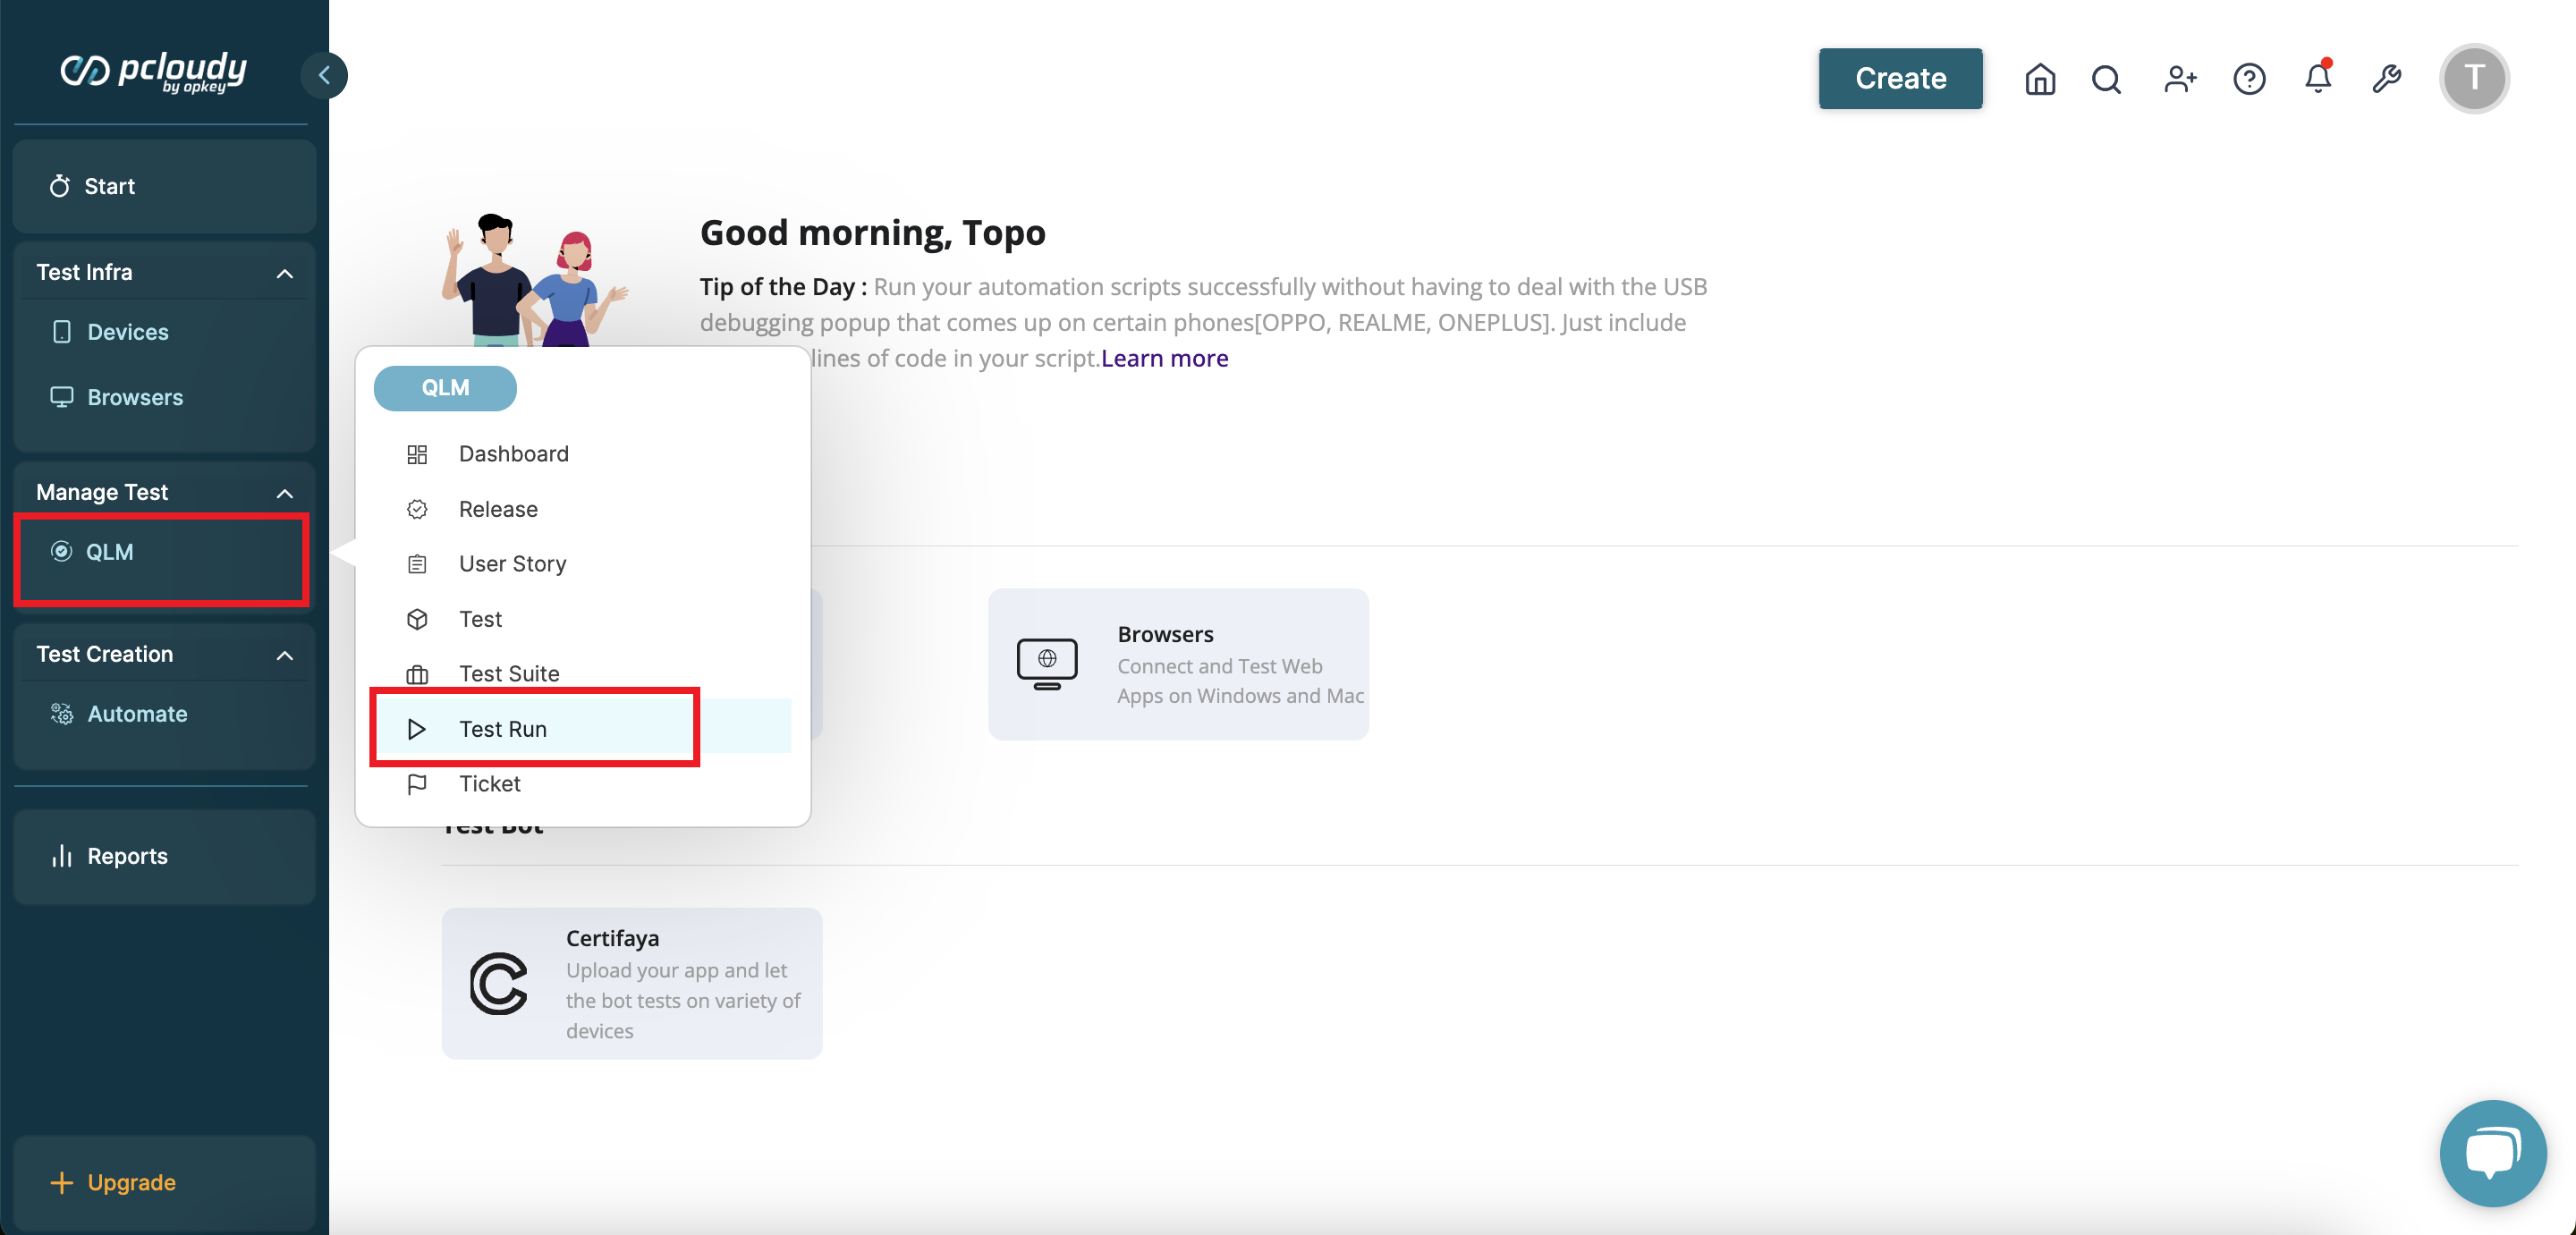
Hover over the QLM section and select Test Run from the available options.
-
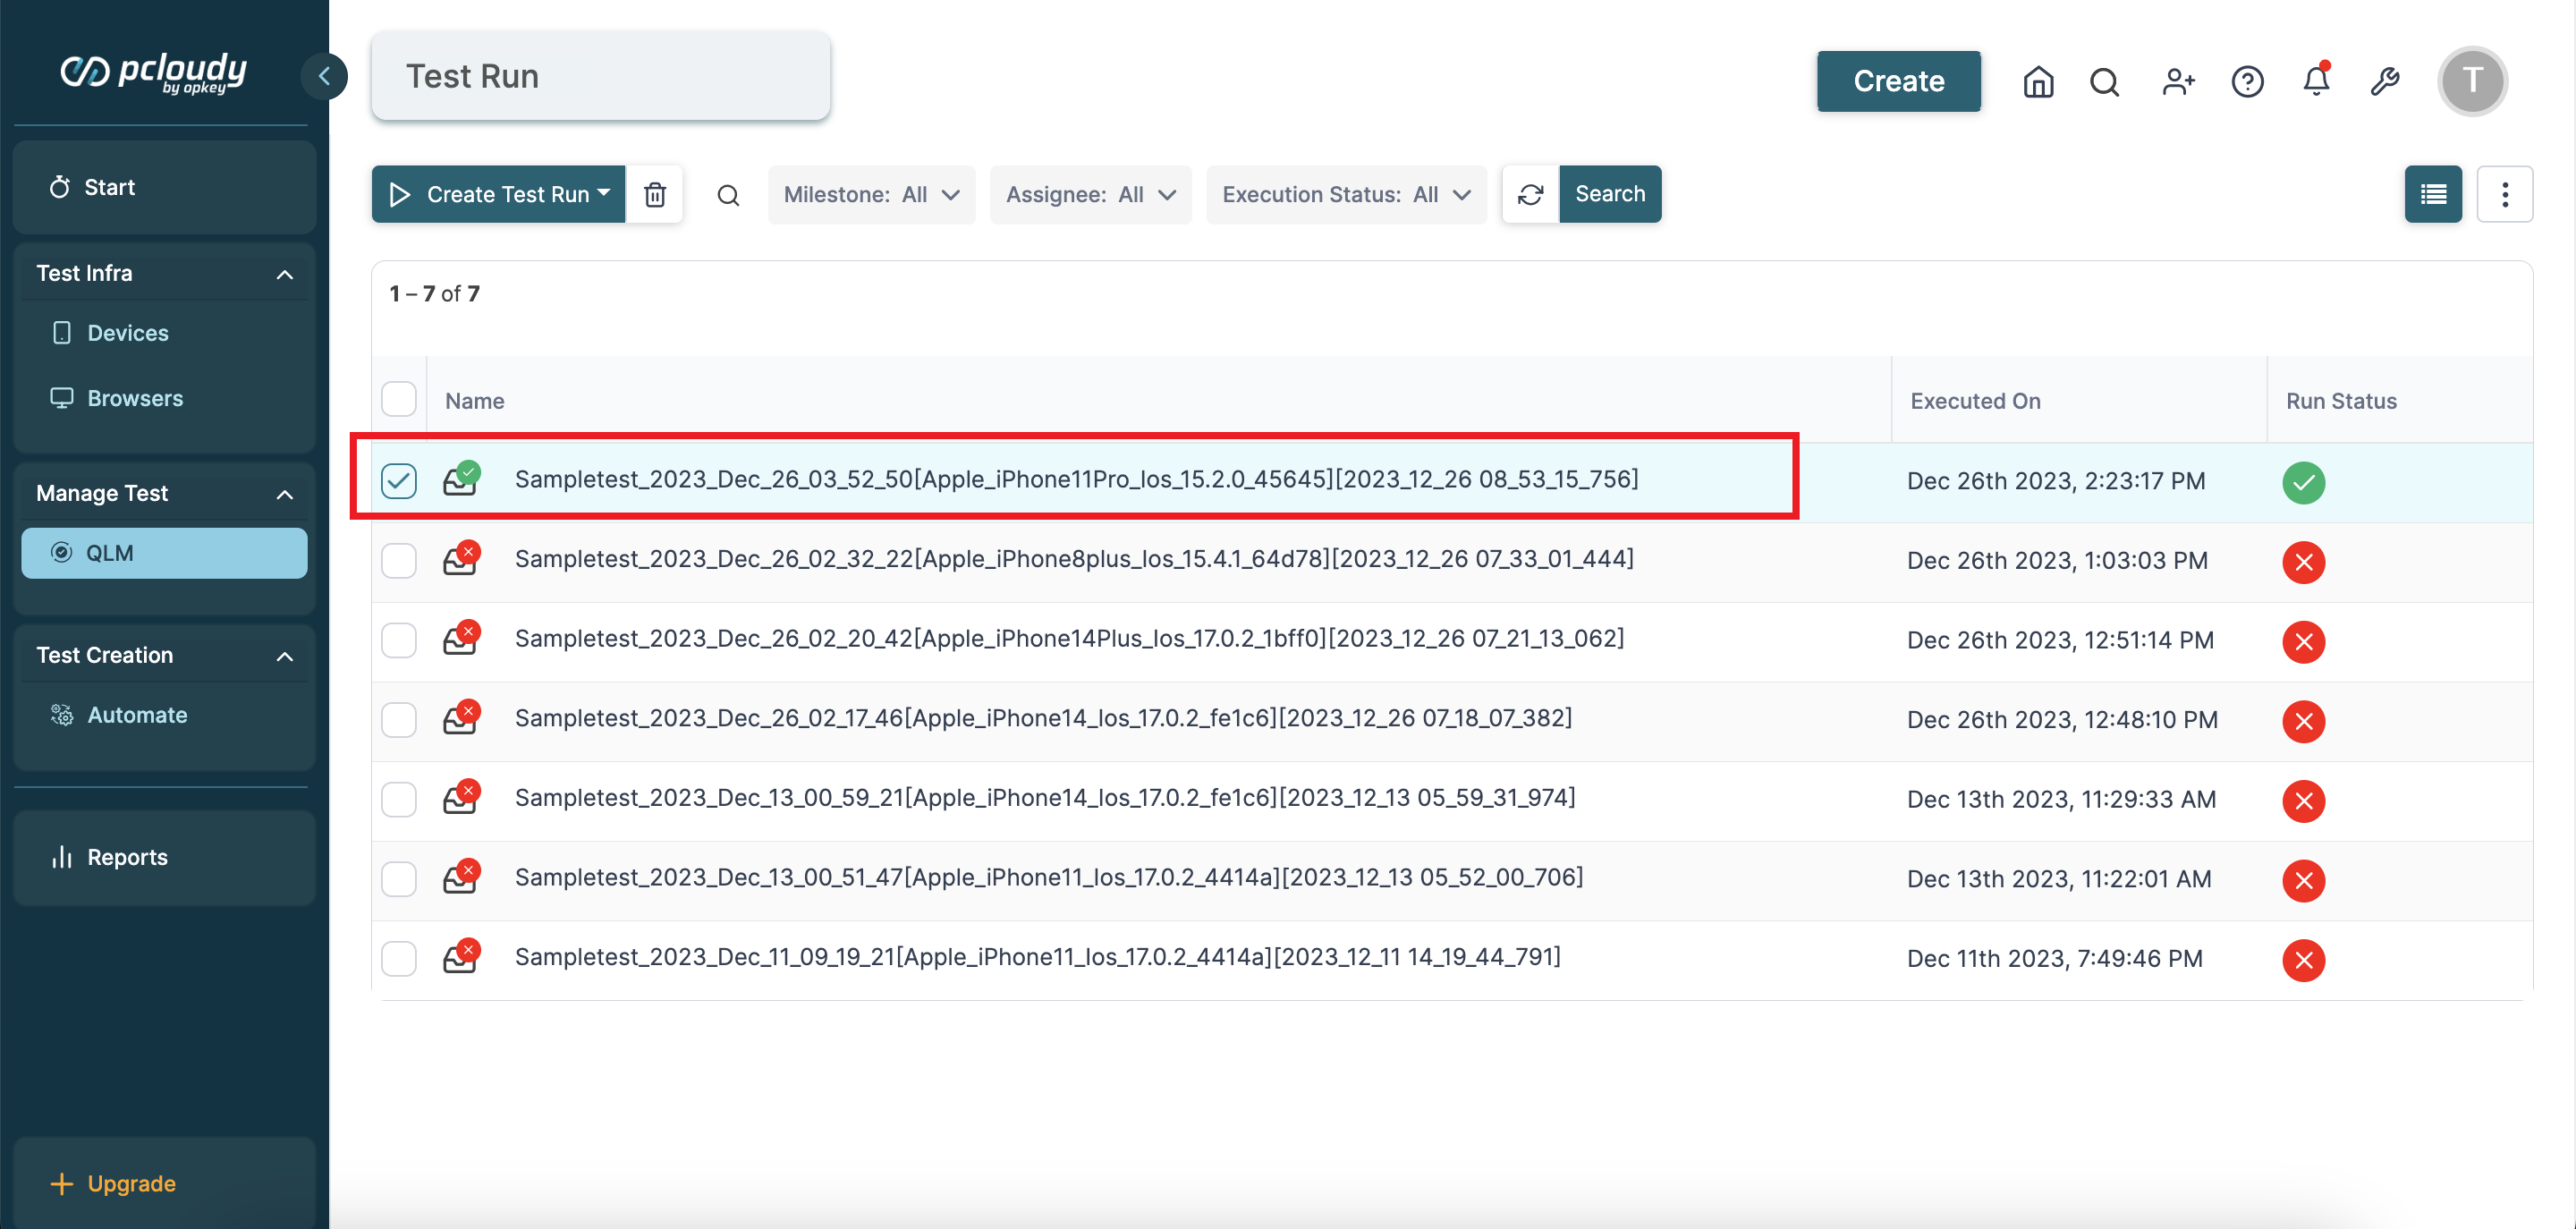
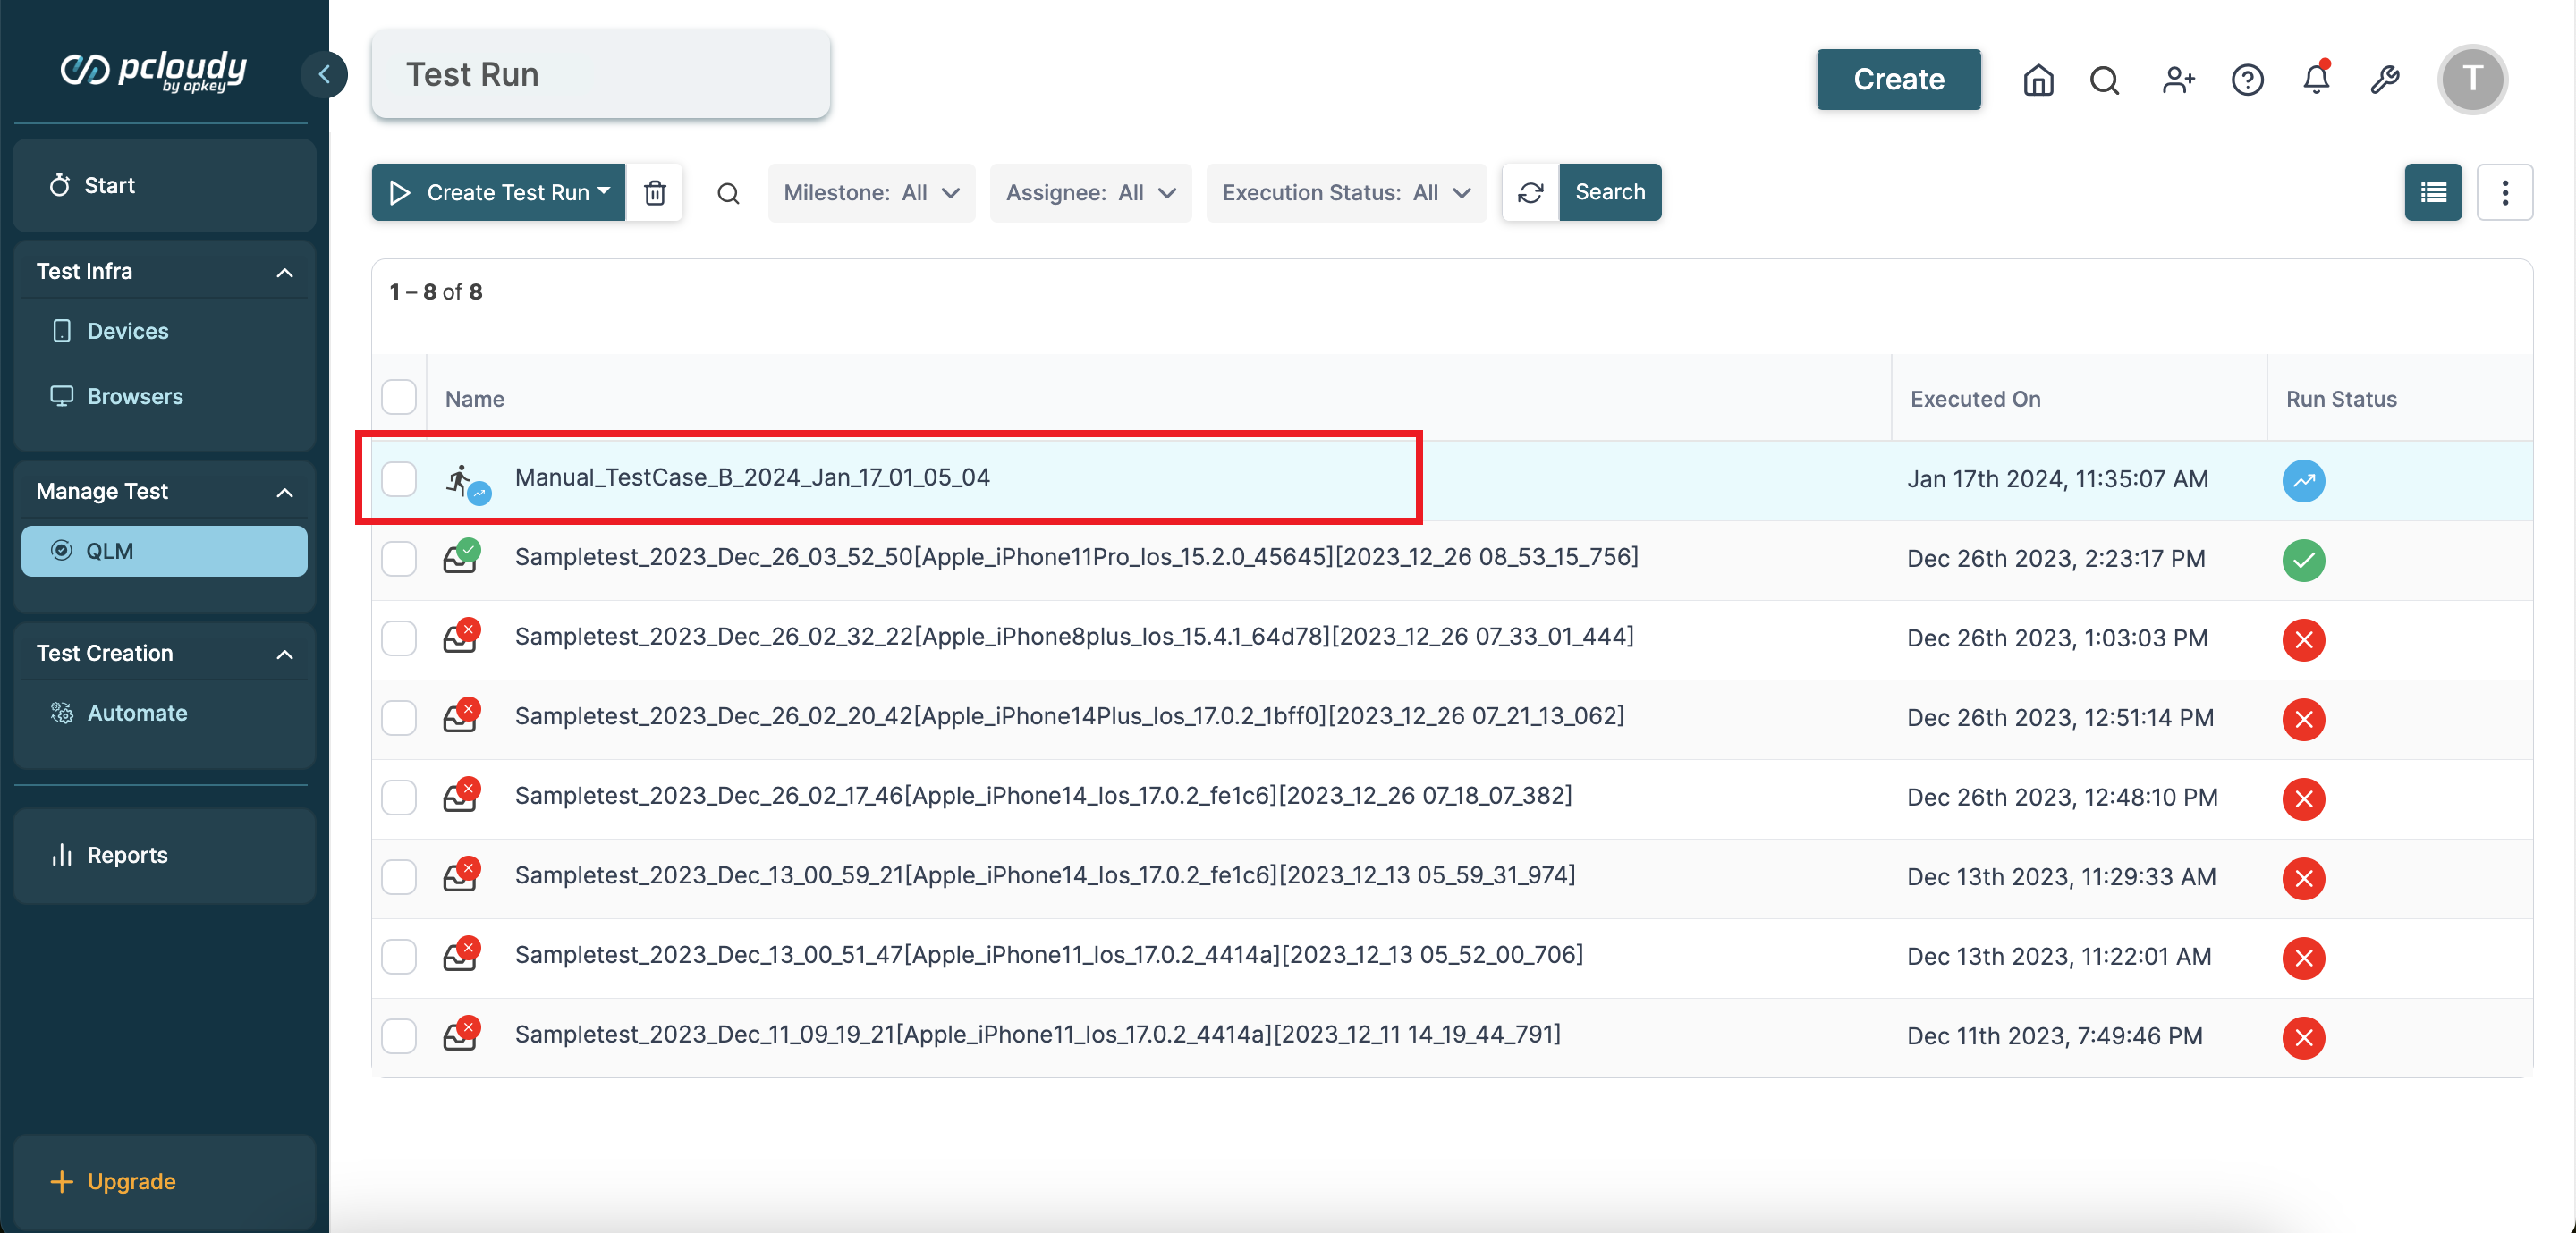
Click on an automated test run result on the test run dashboard.
-
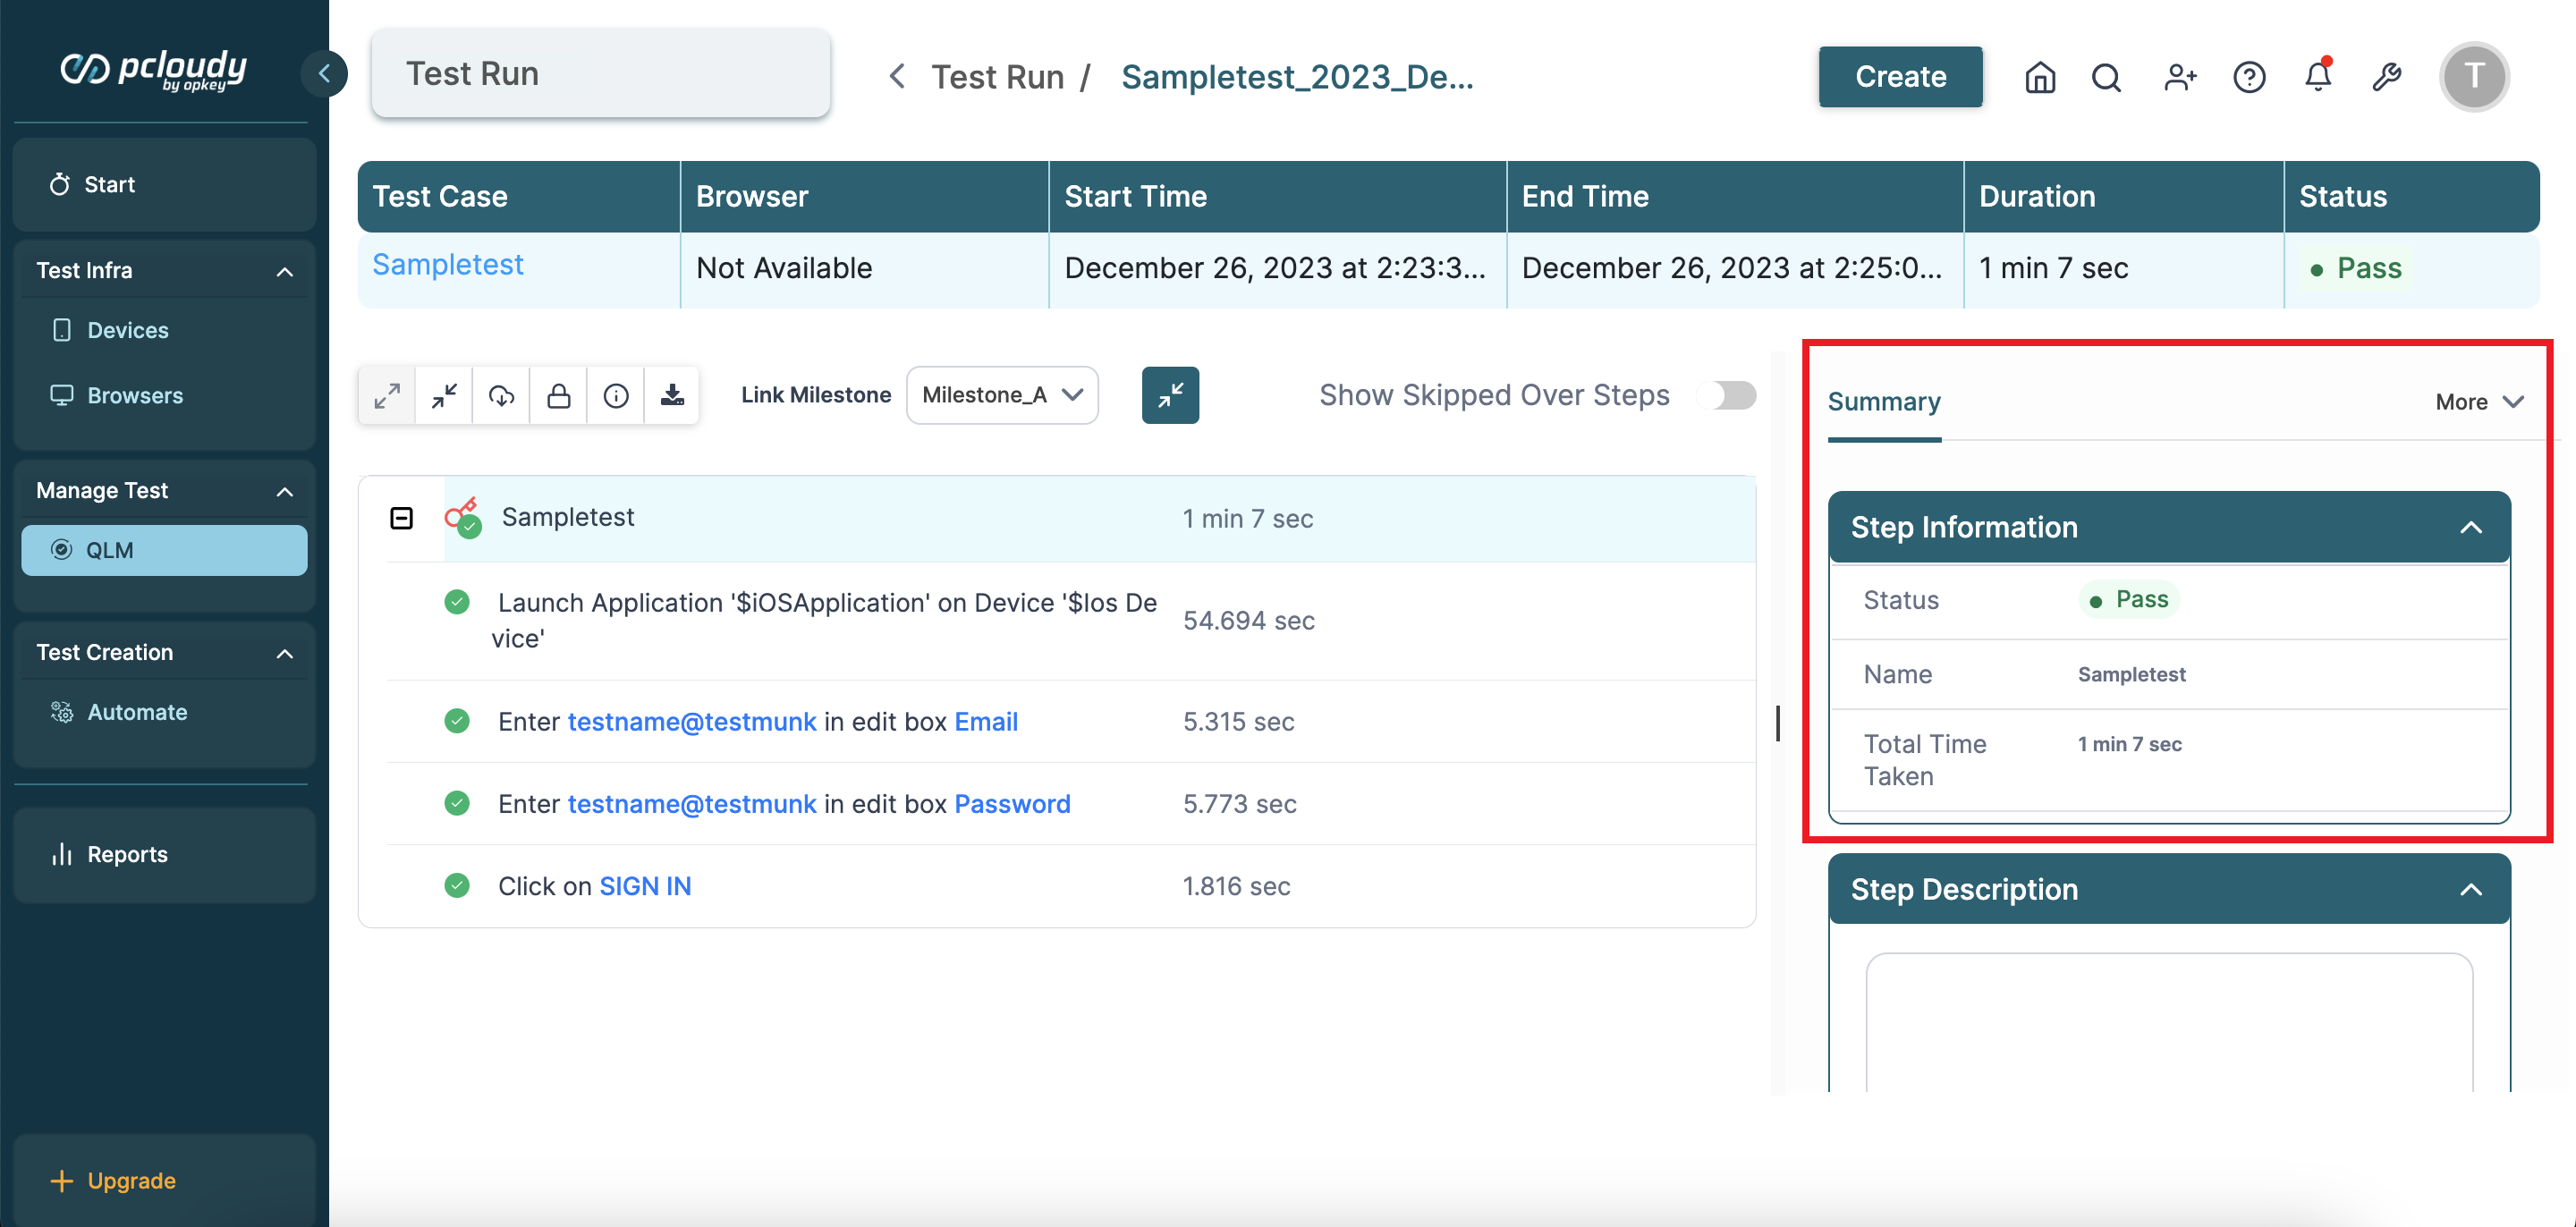
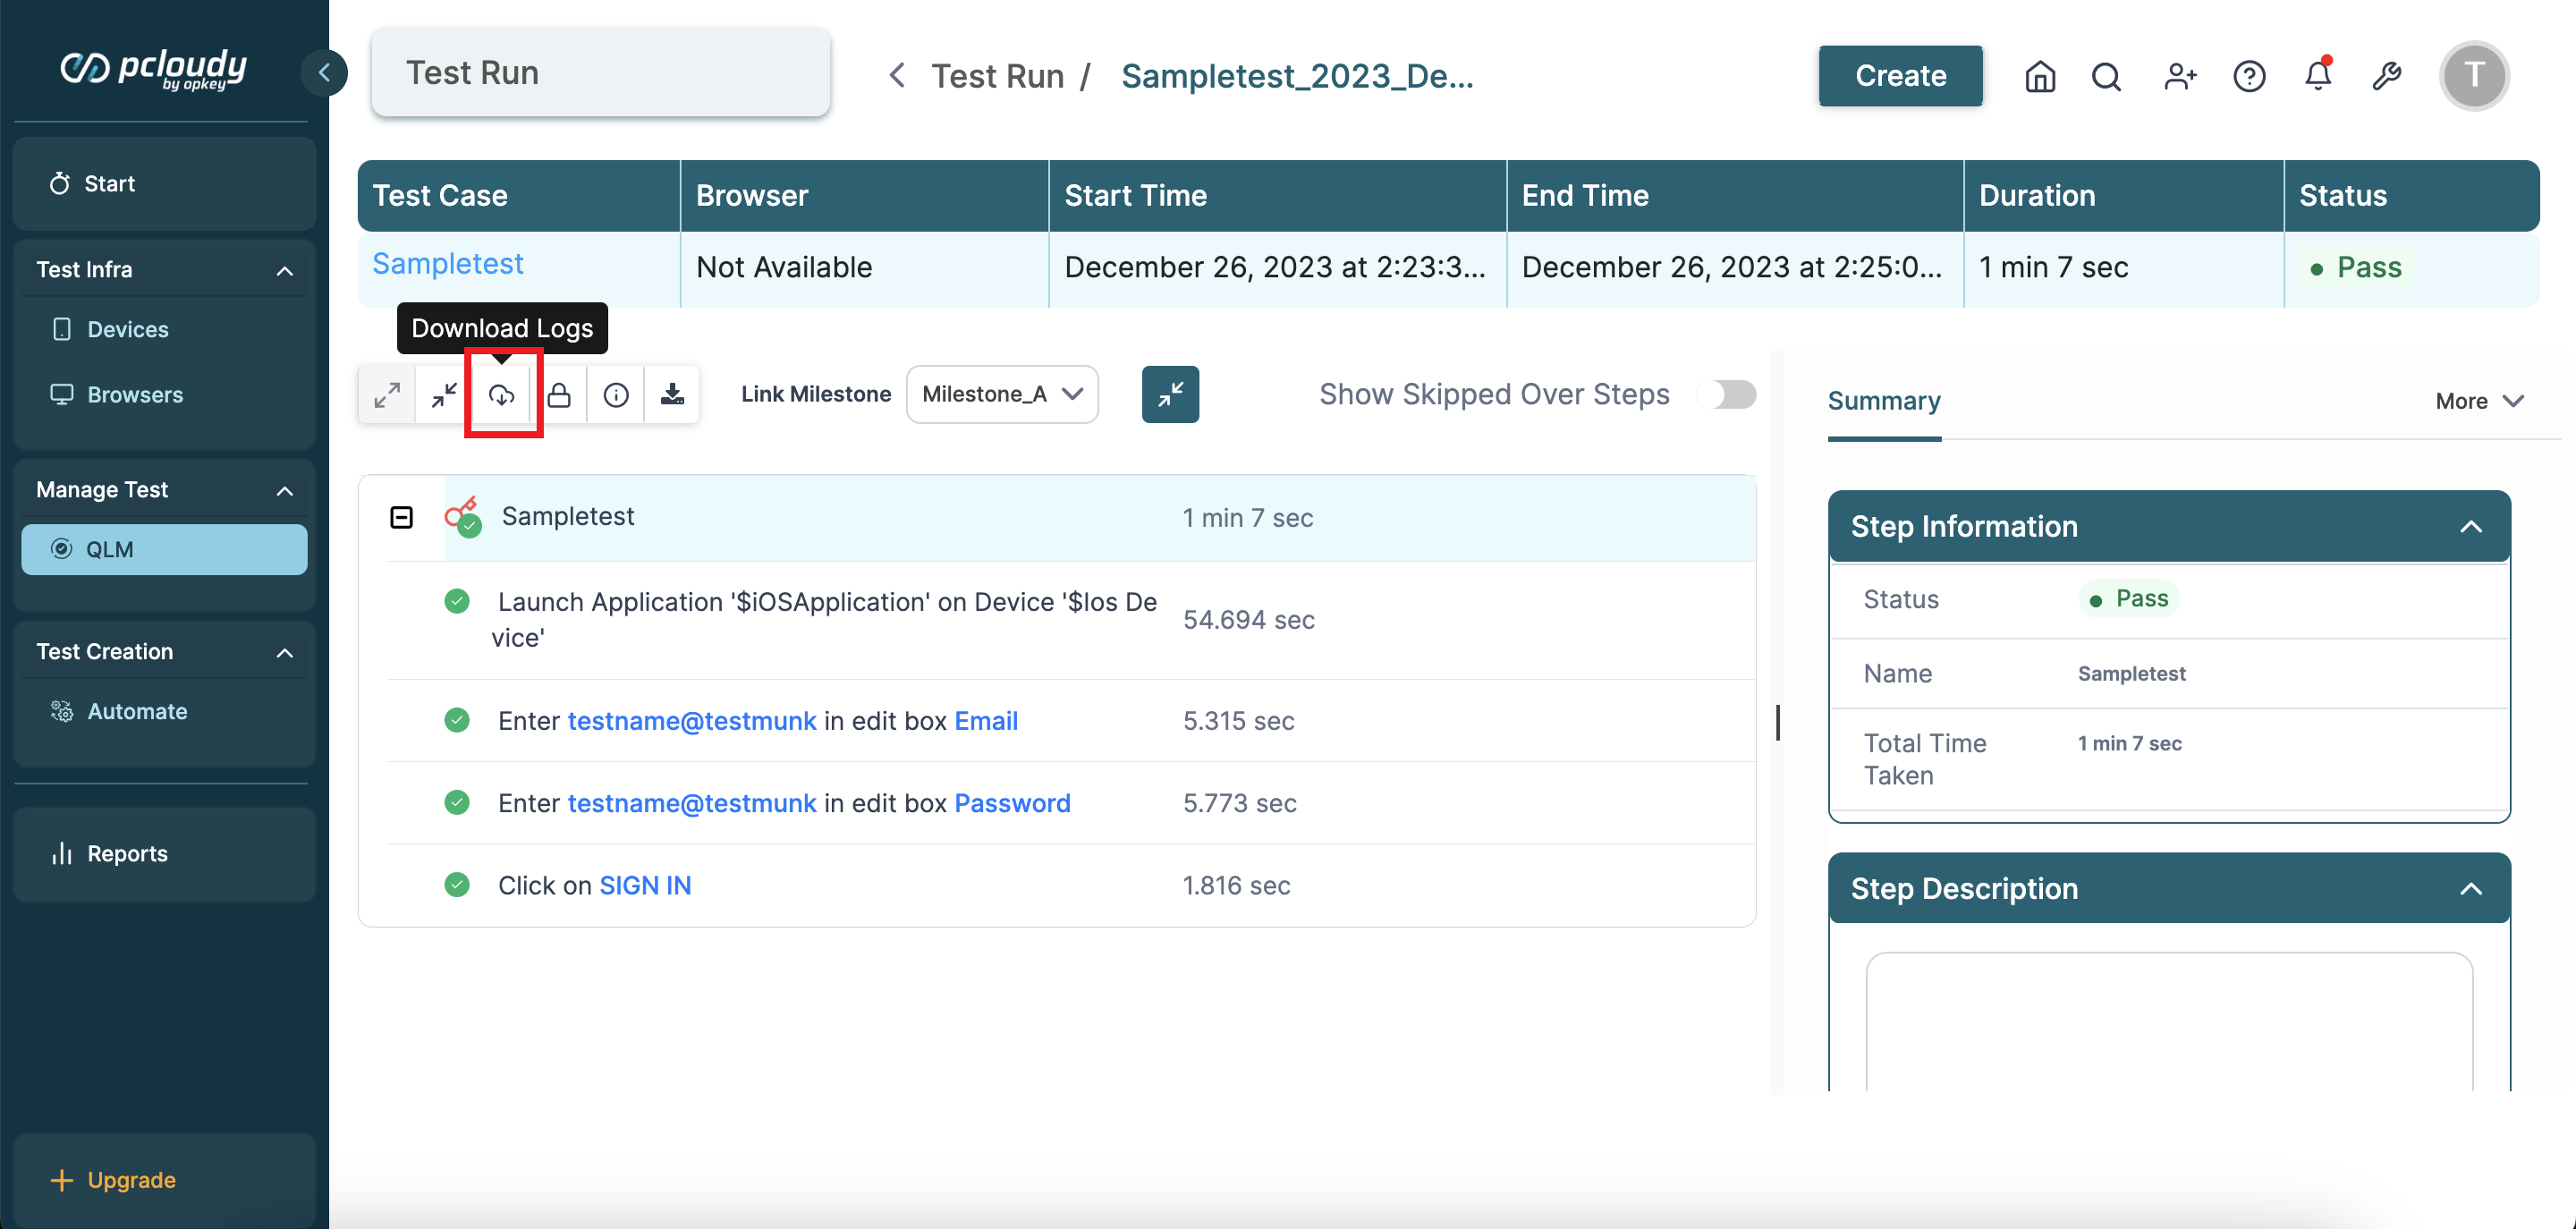
On the right of the page, you can see a summary of the test run.
-
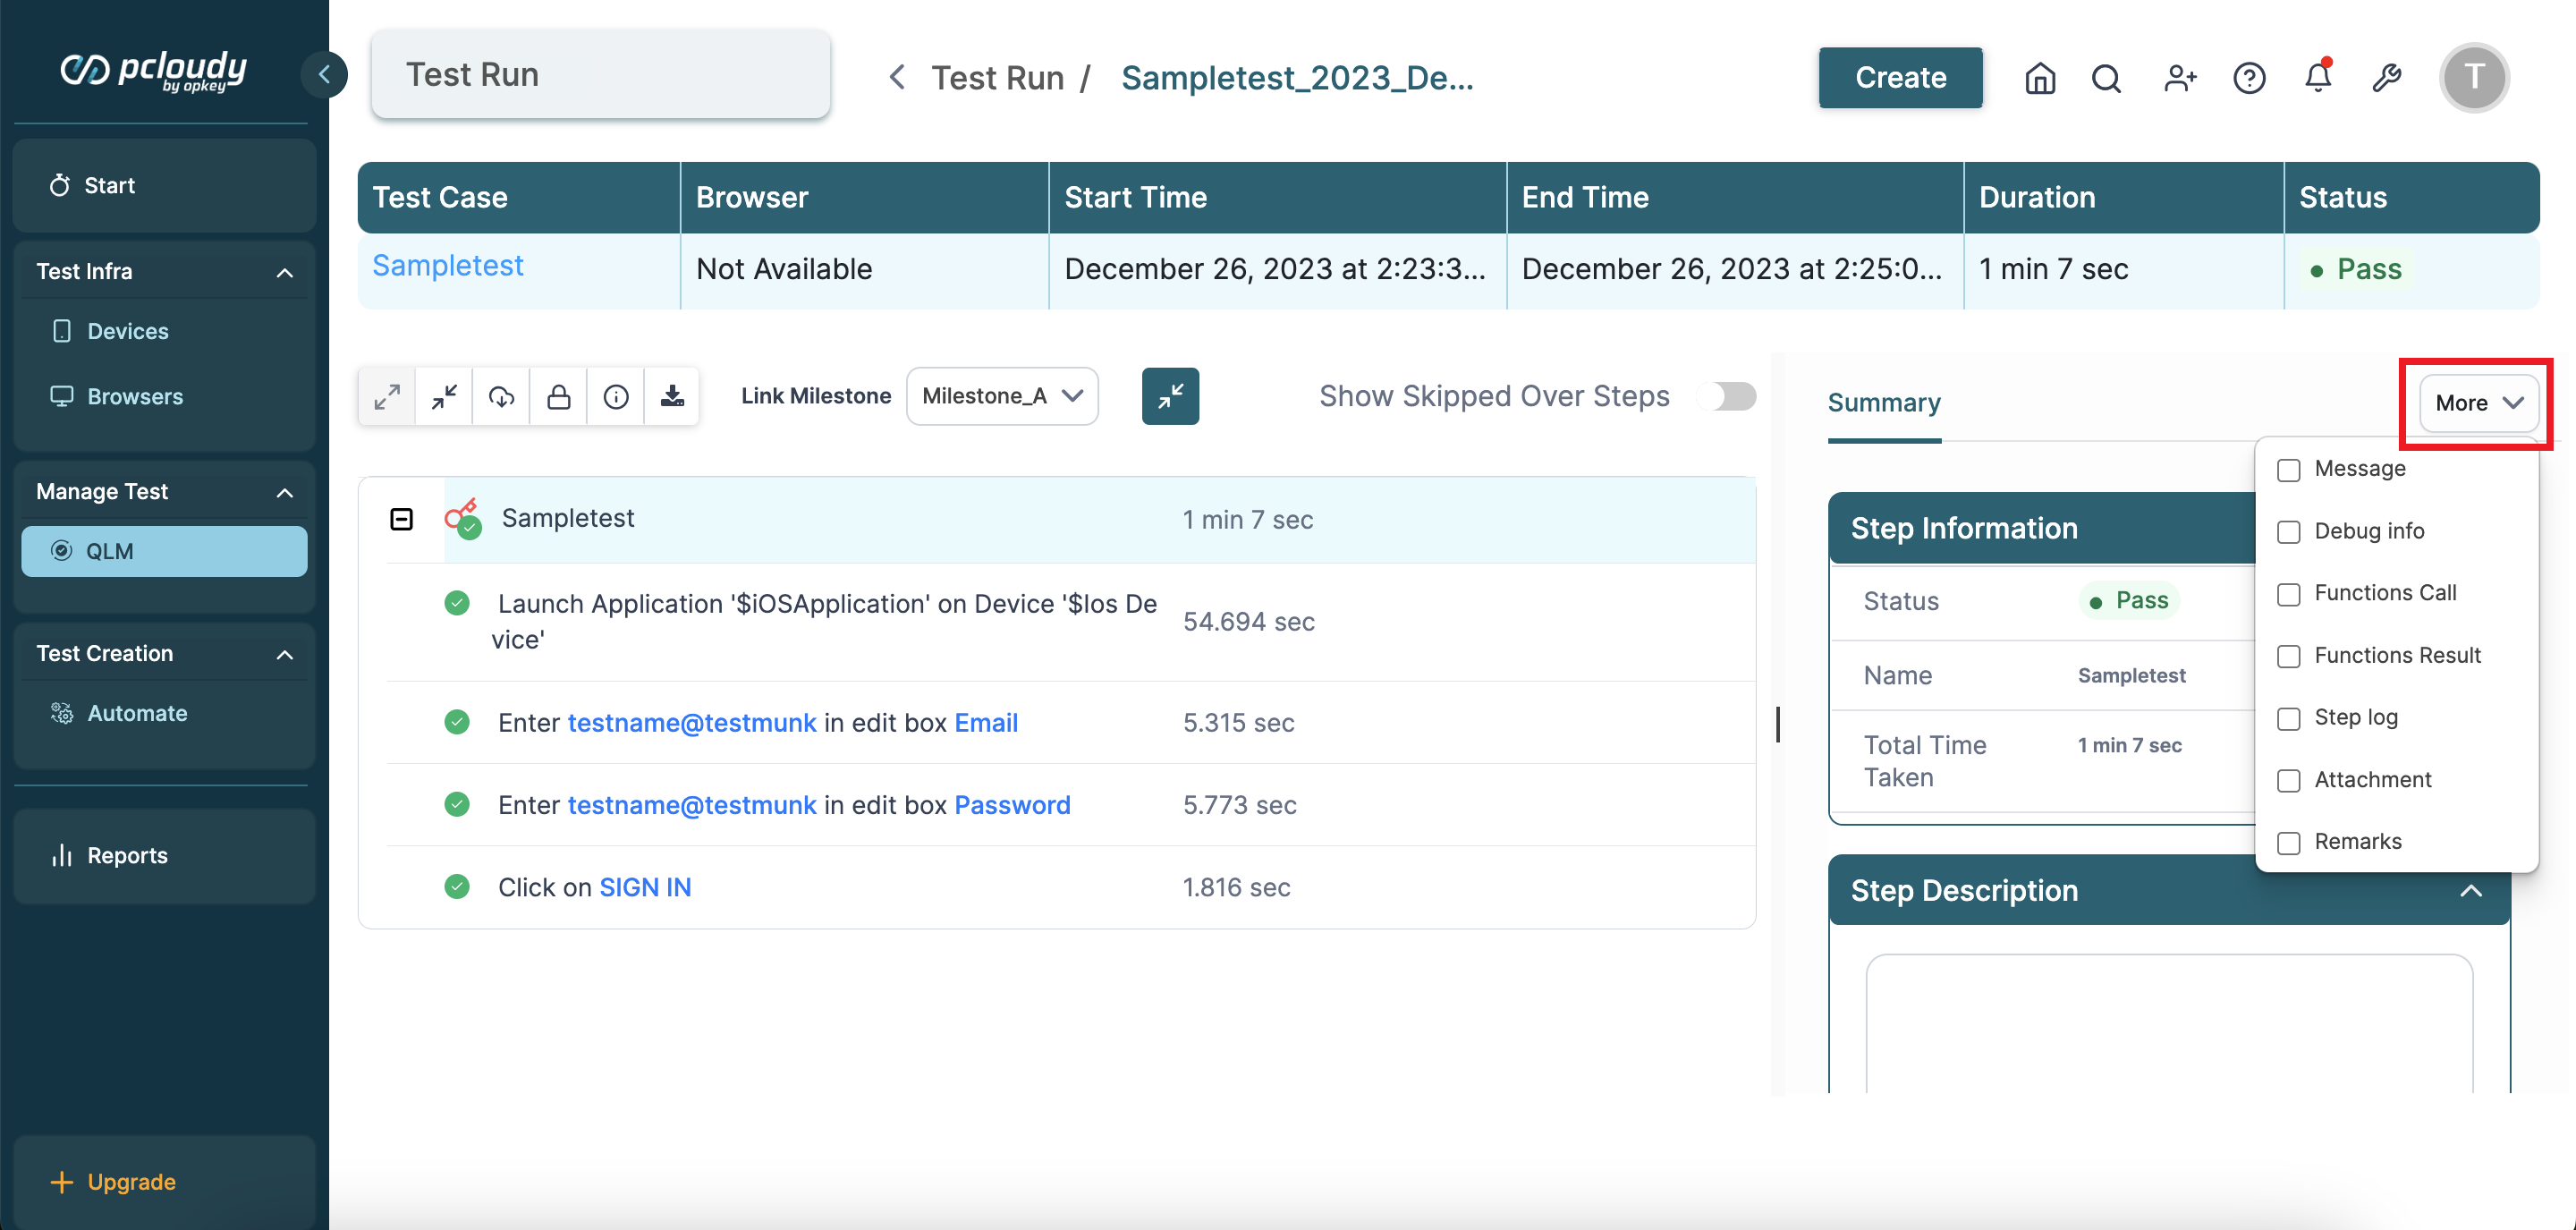
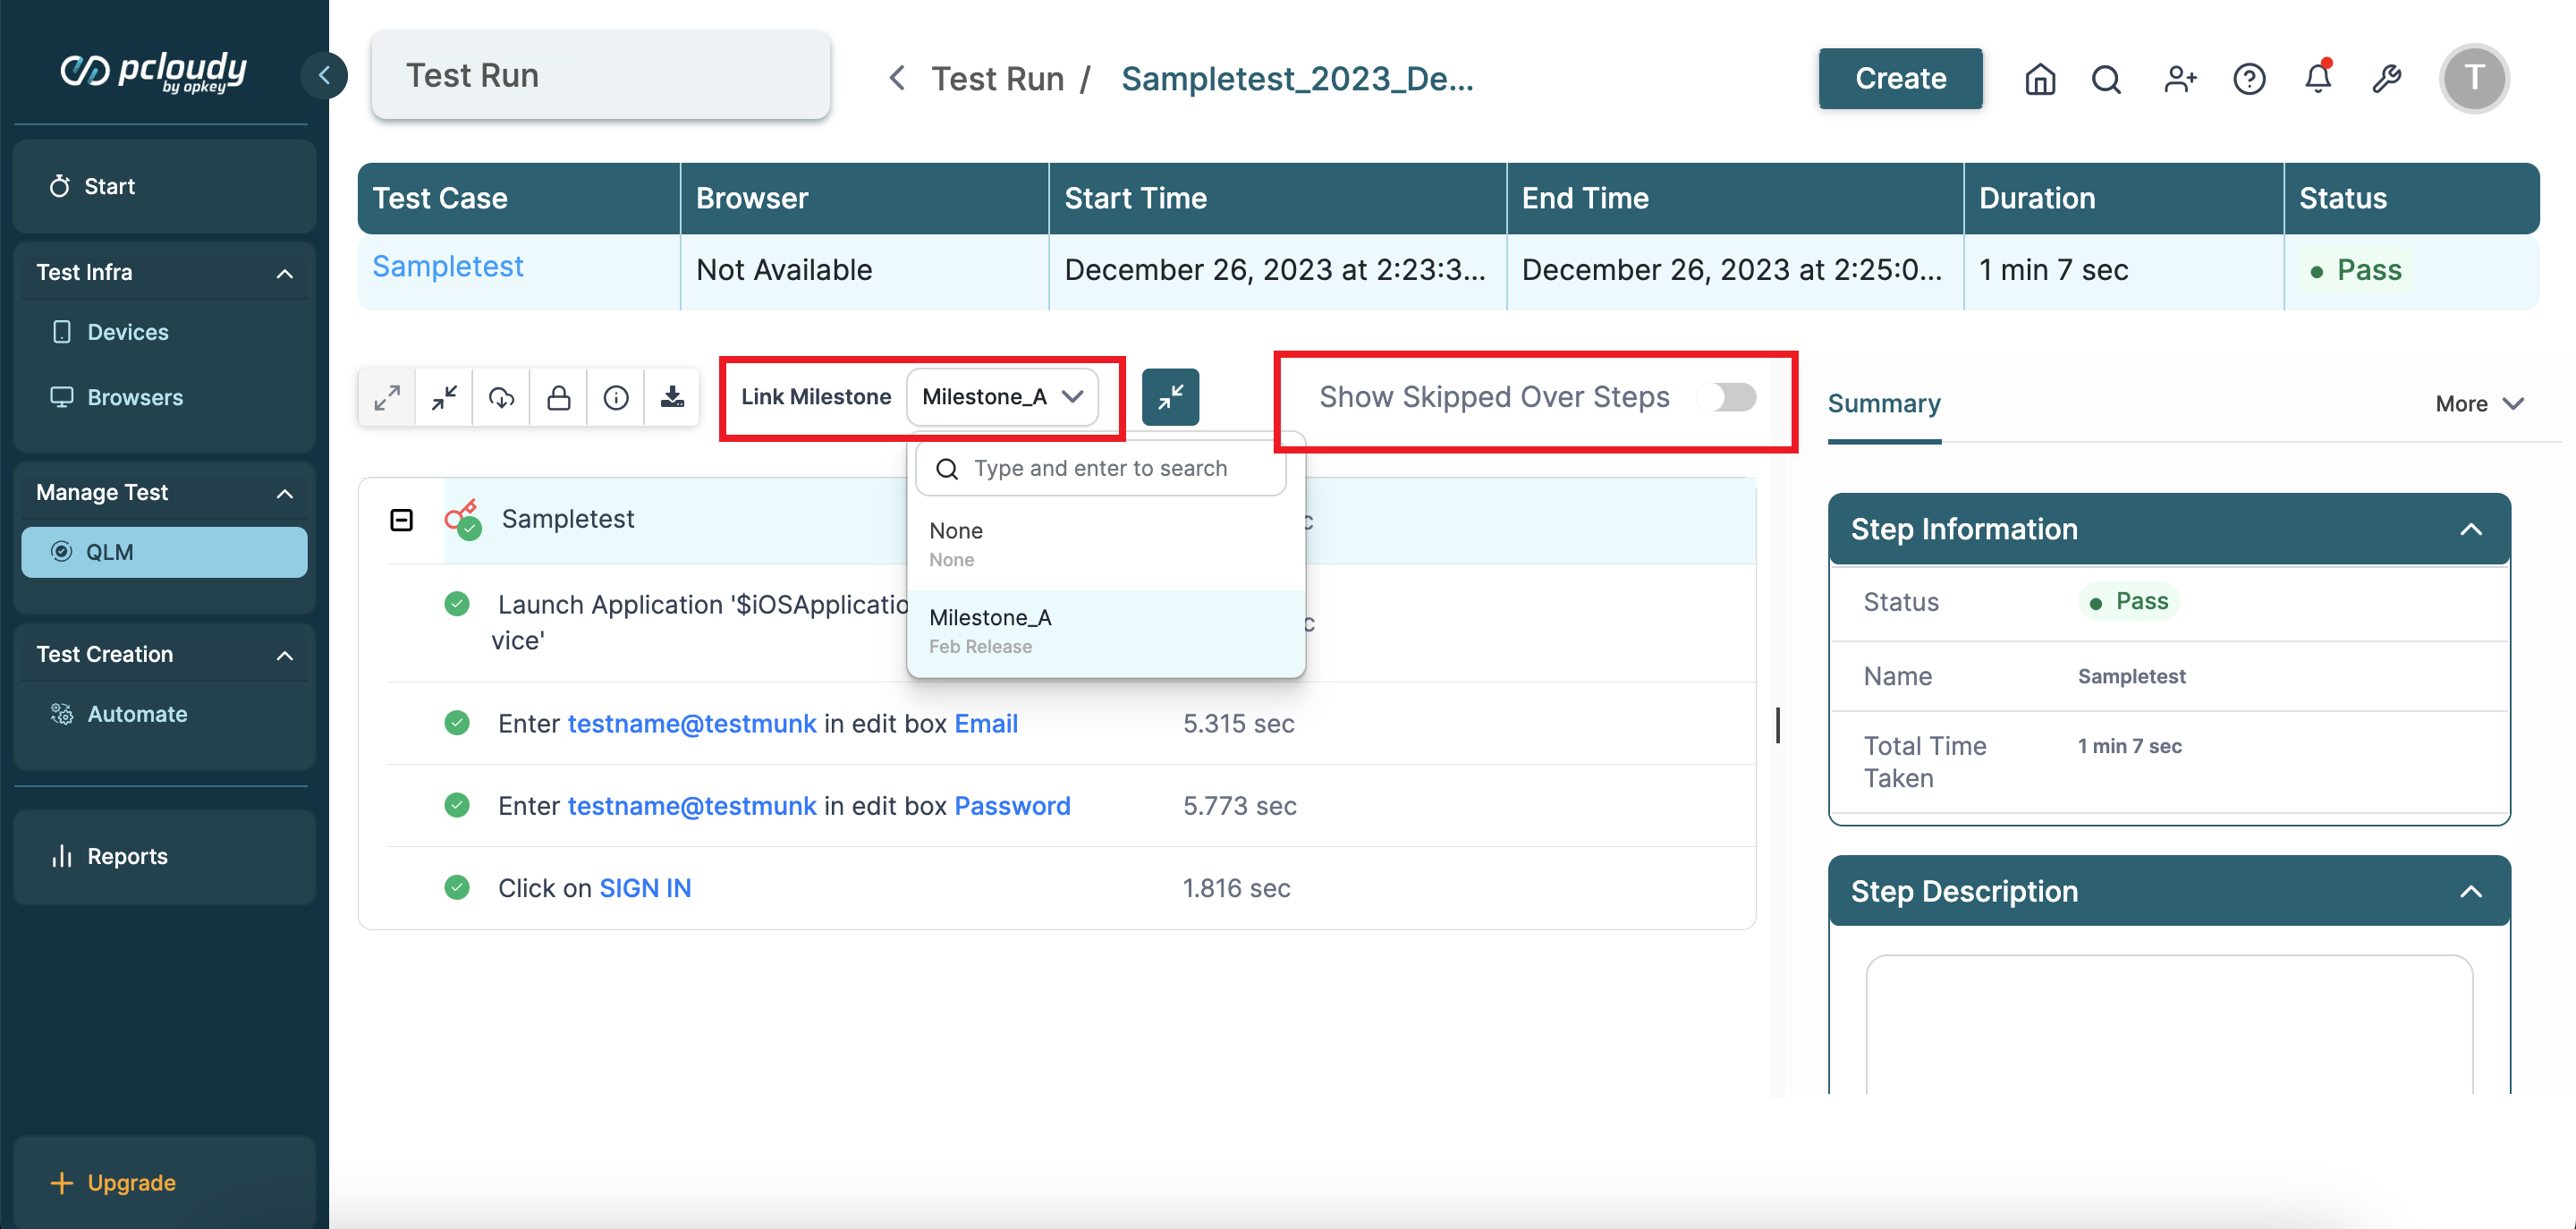
You can click the dropdown to select from filter options such as Message, Debug Info, Function Call, Function Result, Step Log, Attachments, and Remarks.
-
You can also check skipped-over steps and click the dropdown button on the left to link the result to a milestone.
-
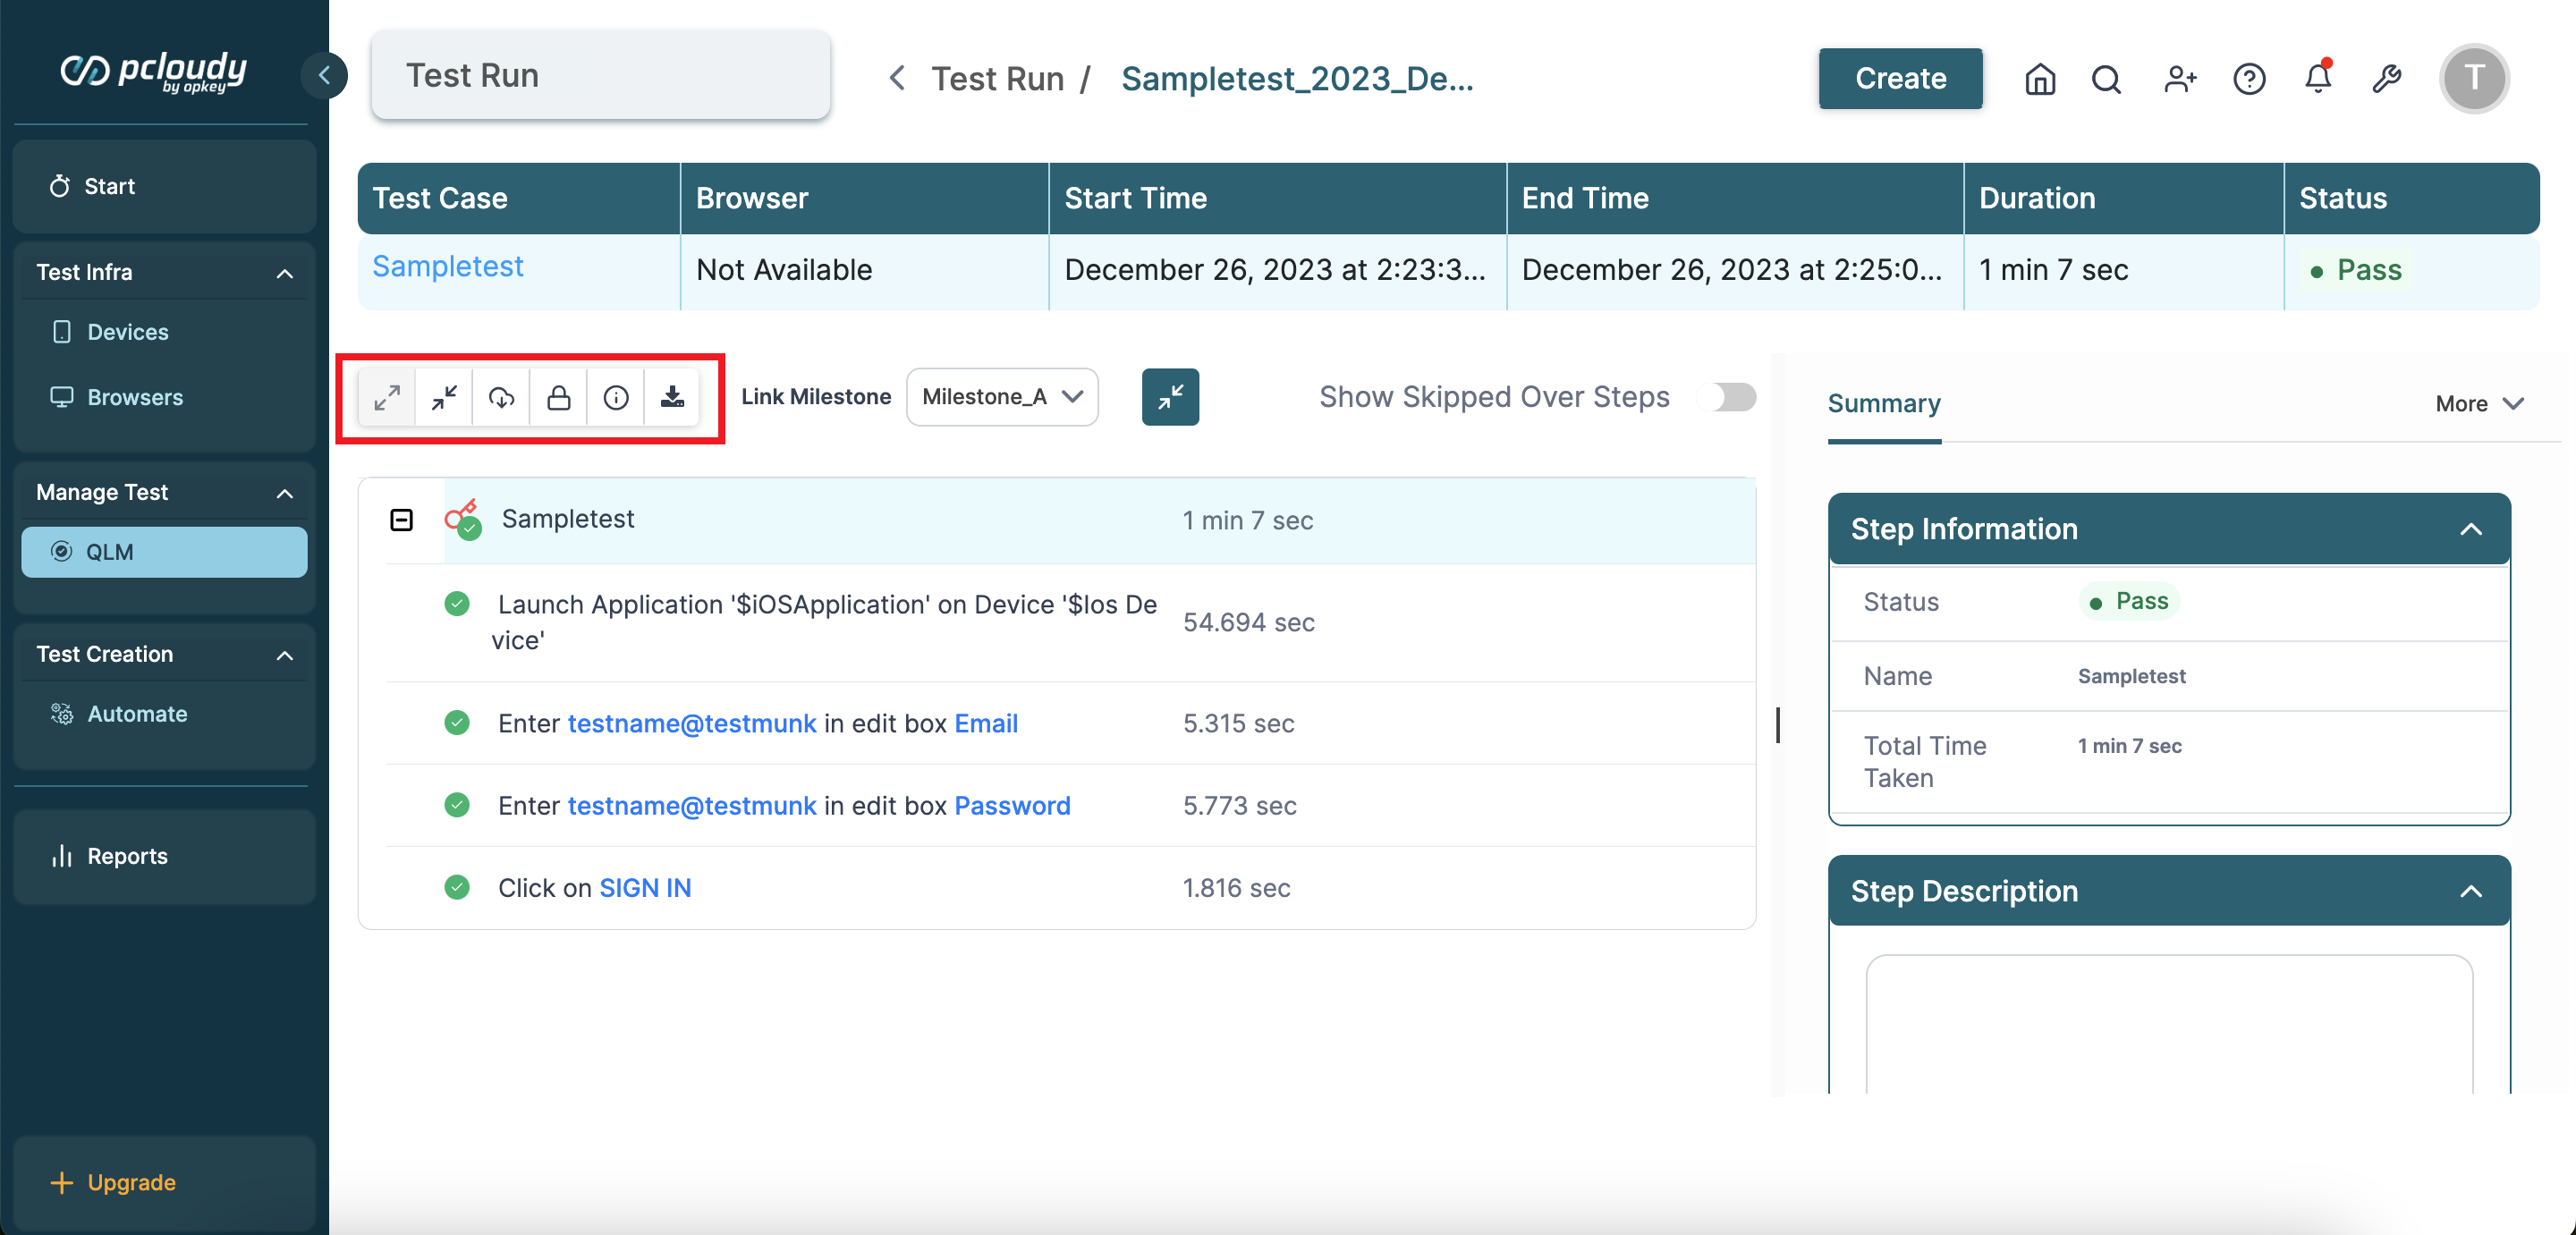
Besides the Link Milestone dropdown, you can see the panel icons to fetch information, download execution logs, and expand or collapse the view.
-
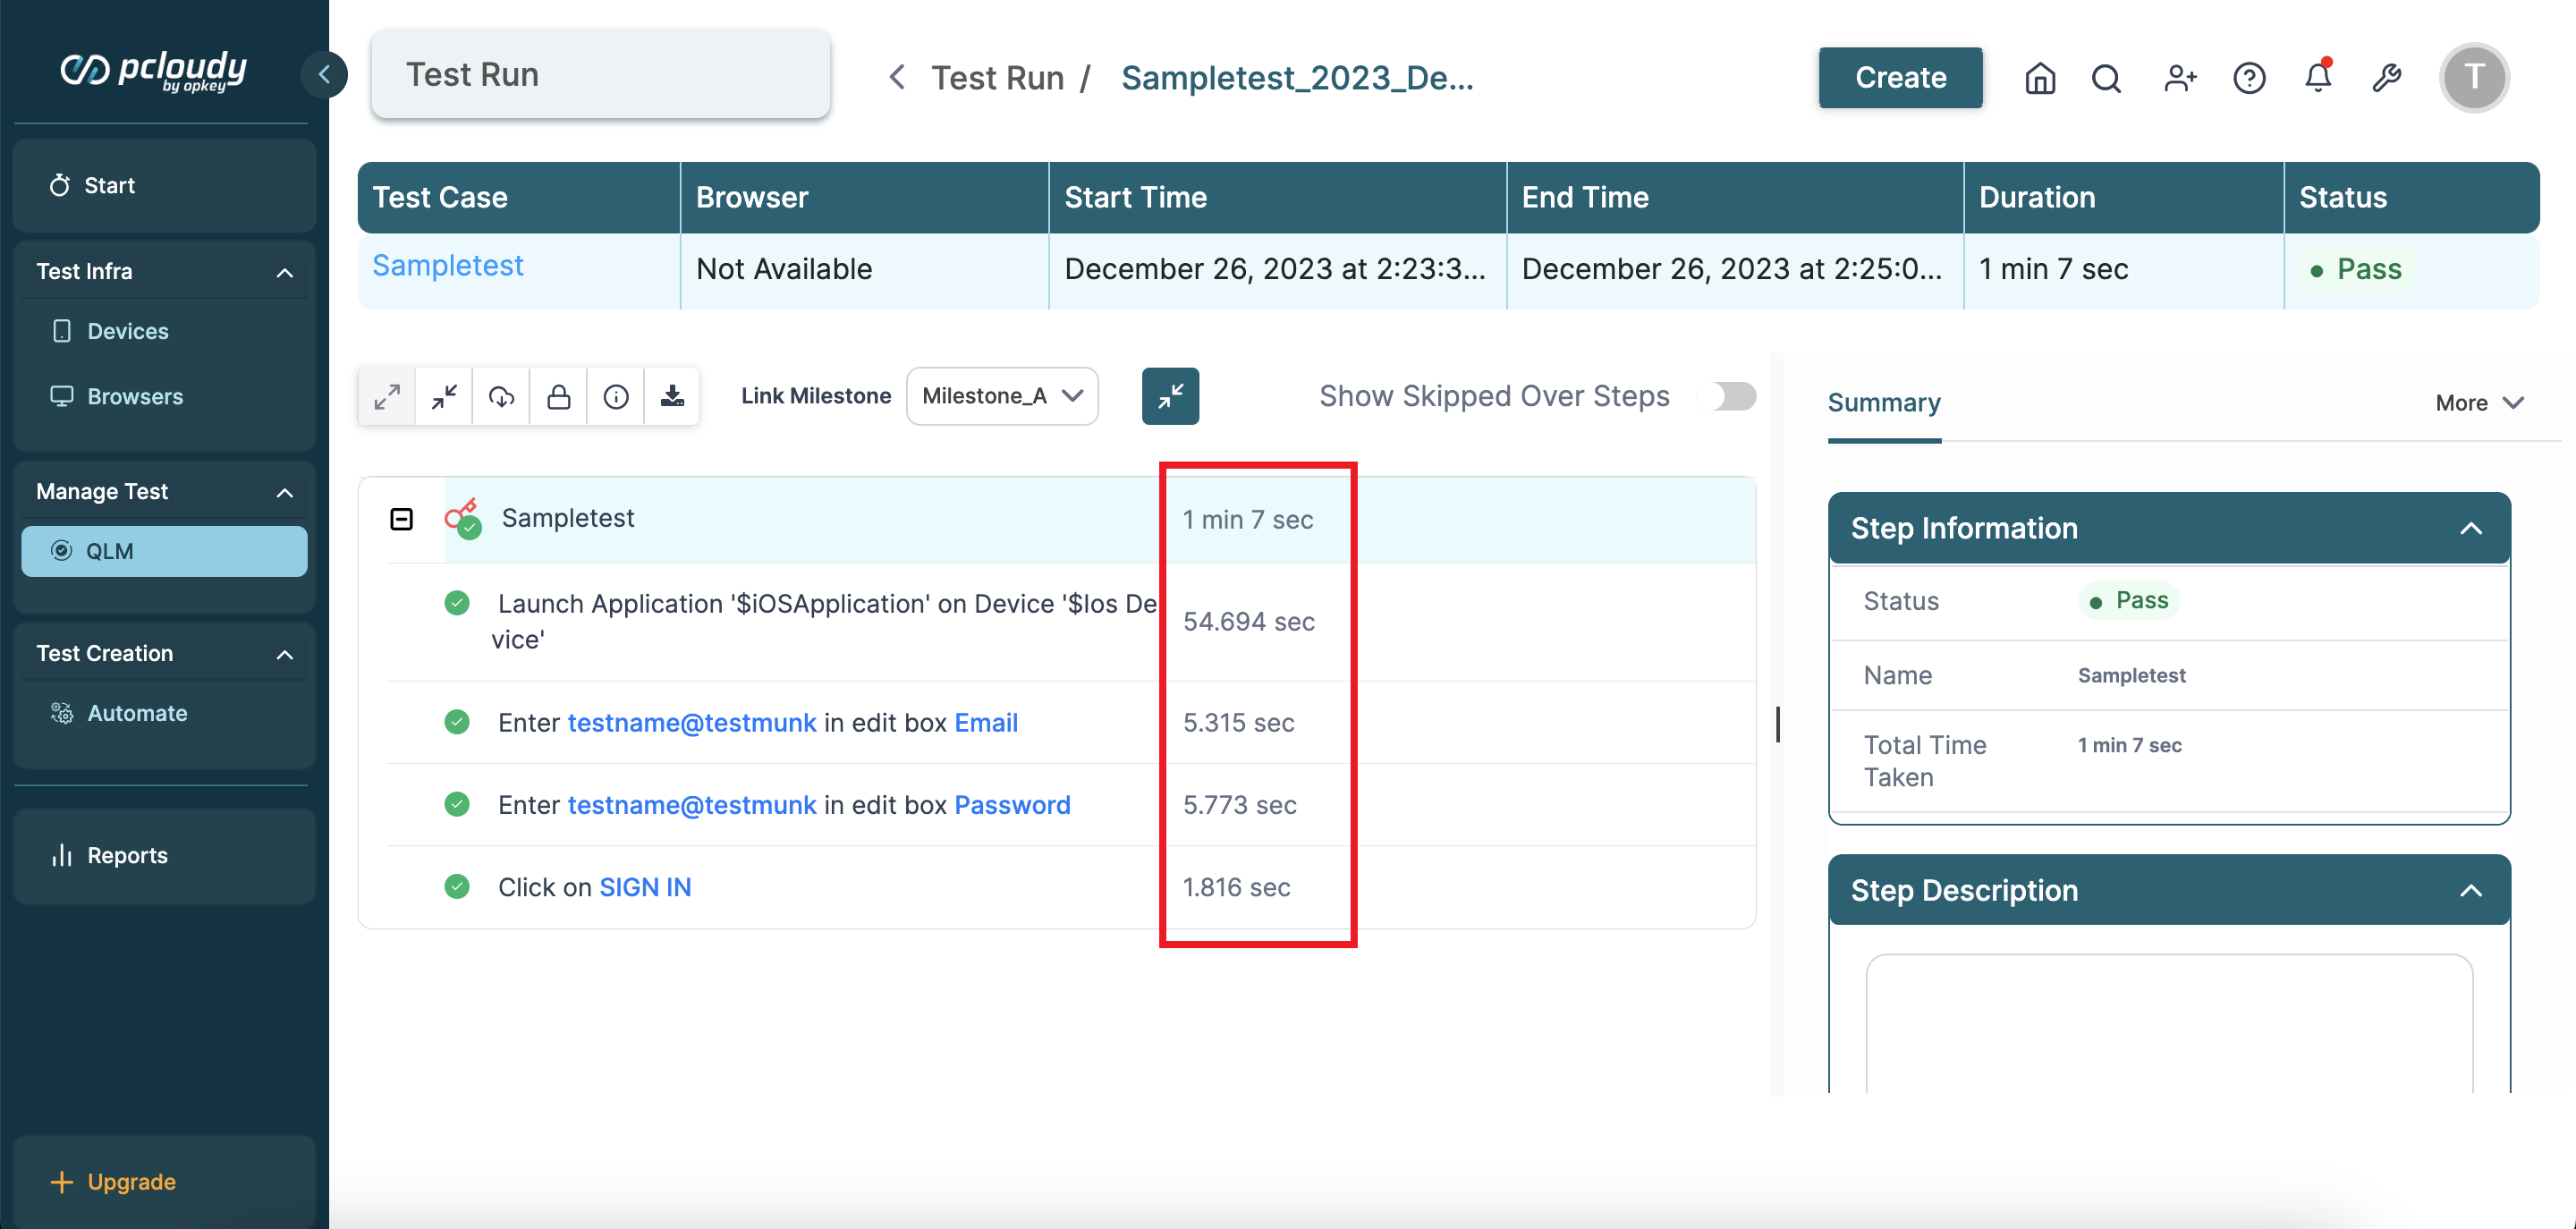
Below the panel, you can view the test steps with their execution time log.
-
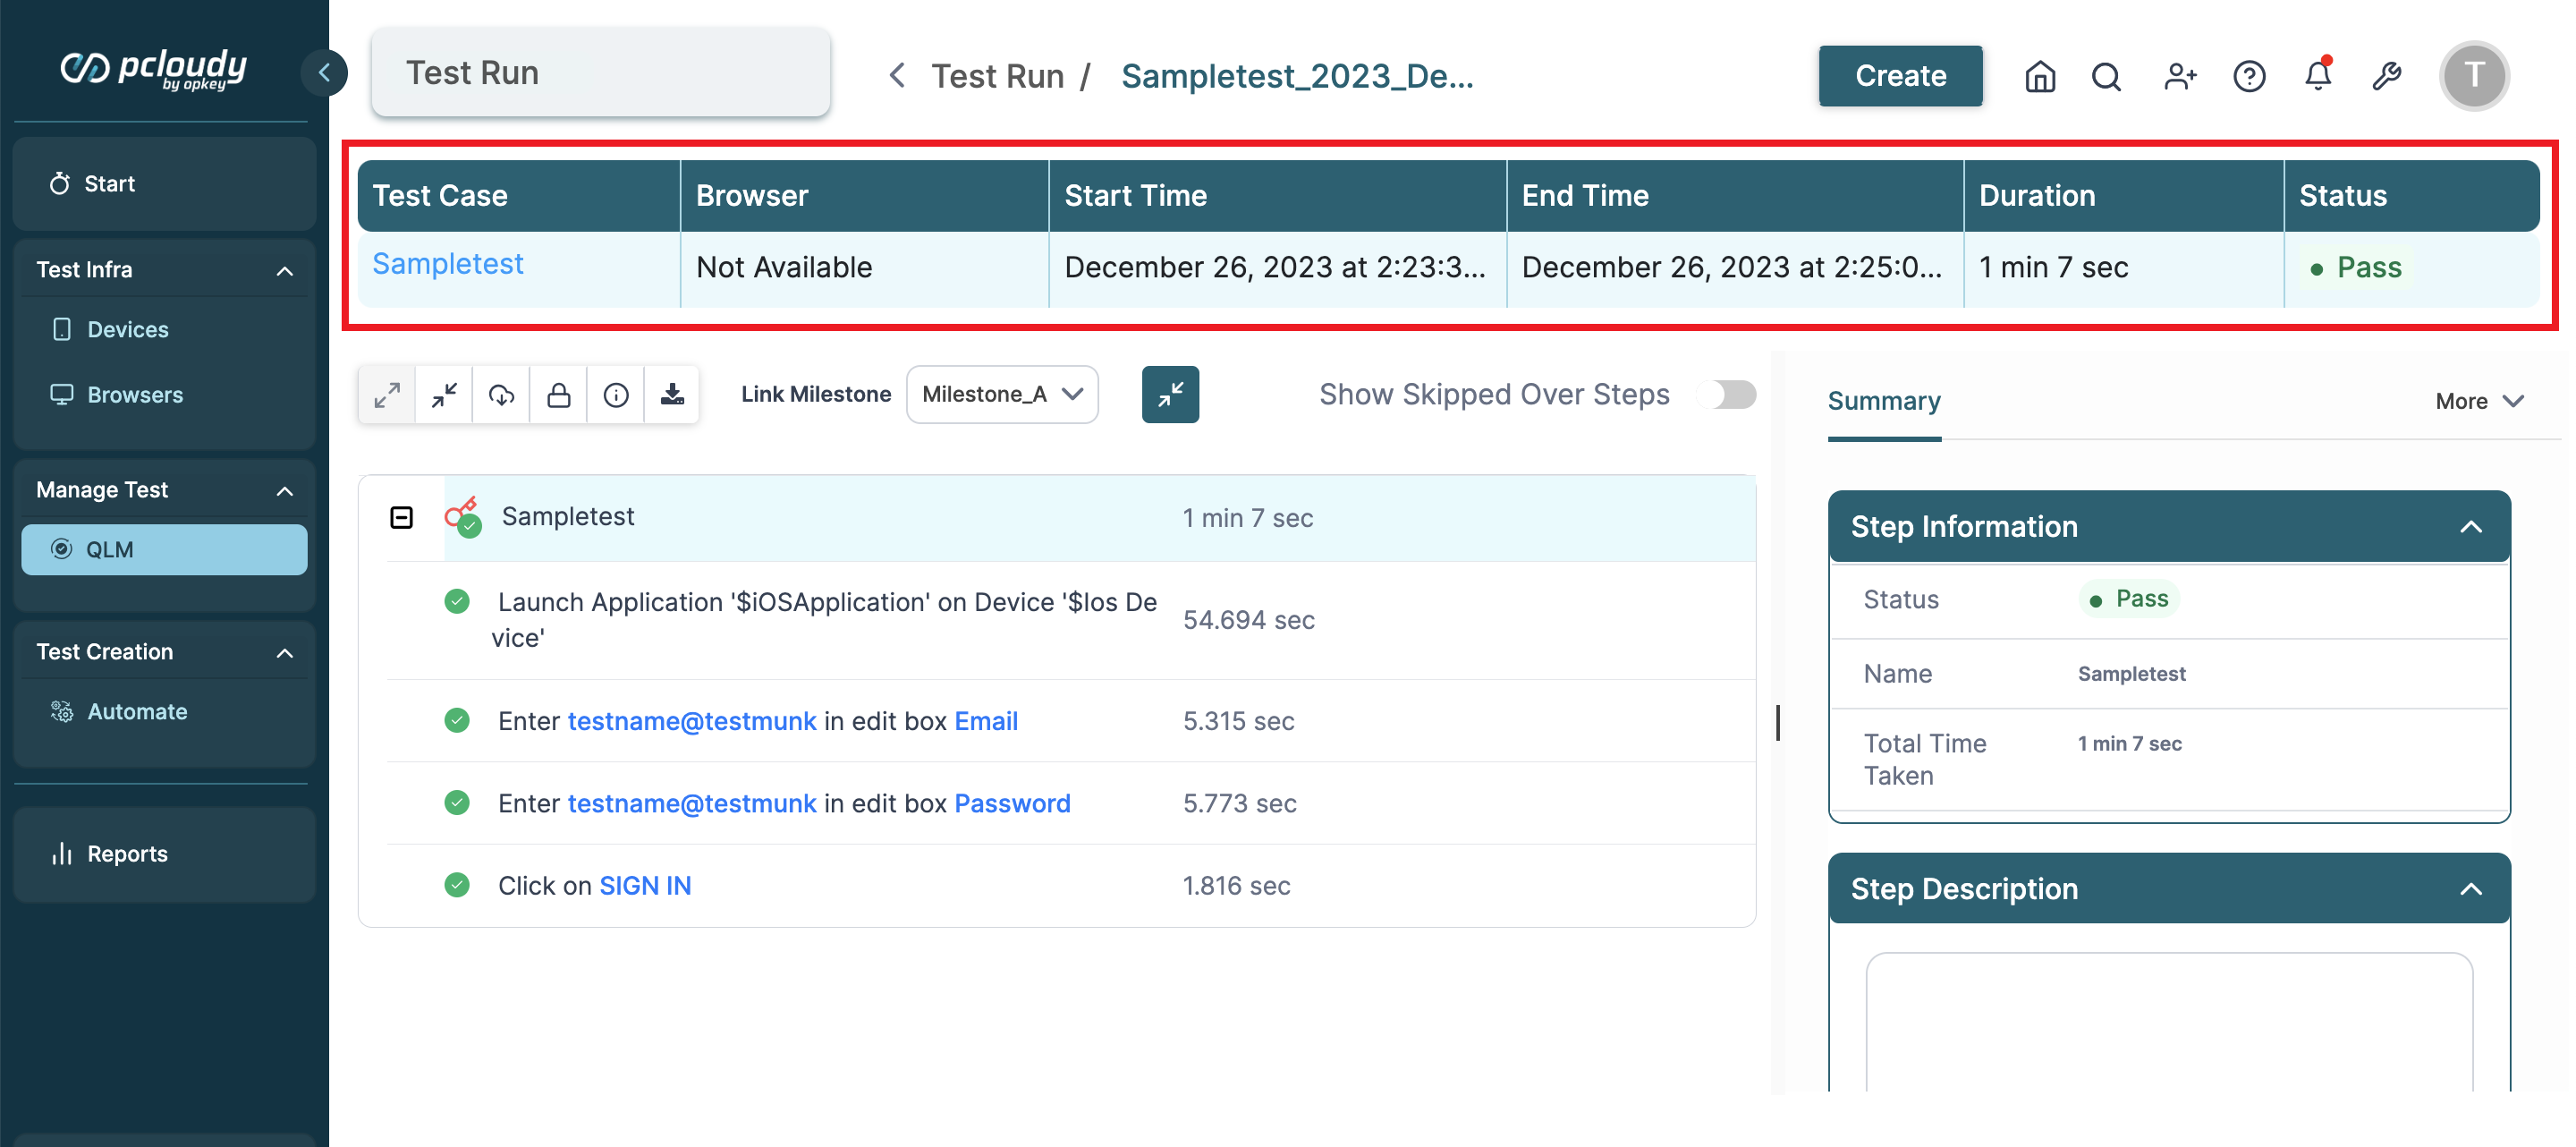
In the panel on the top, you can see the test execution status with details link, browser, start and end time stamp, and duration of test execution.
-
You can click the Download Logs icon to start downloading the test execution log file. The logs get downloaded in a ZIP file.
Now, let's analyze a manual test result.
-
Go to the test run dashboard and open a manual test execution result page.
-
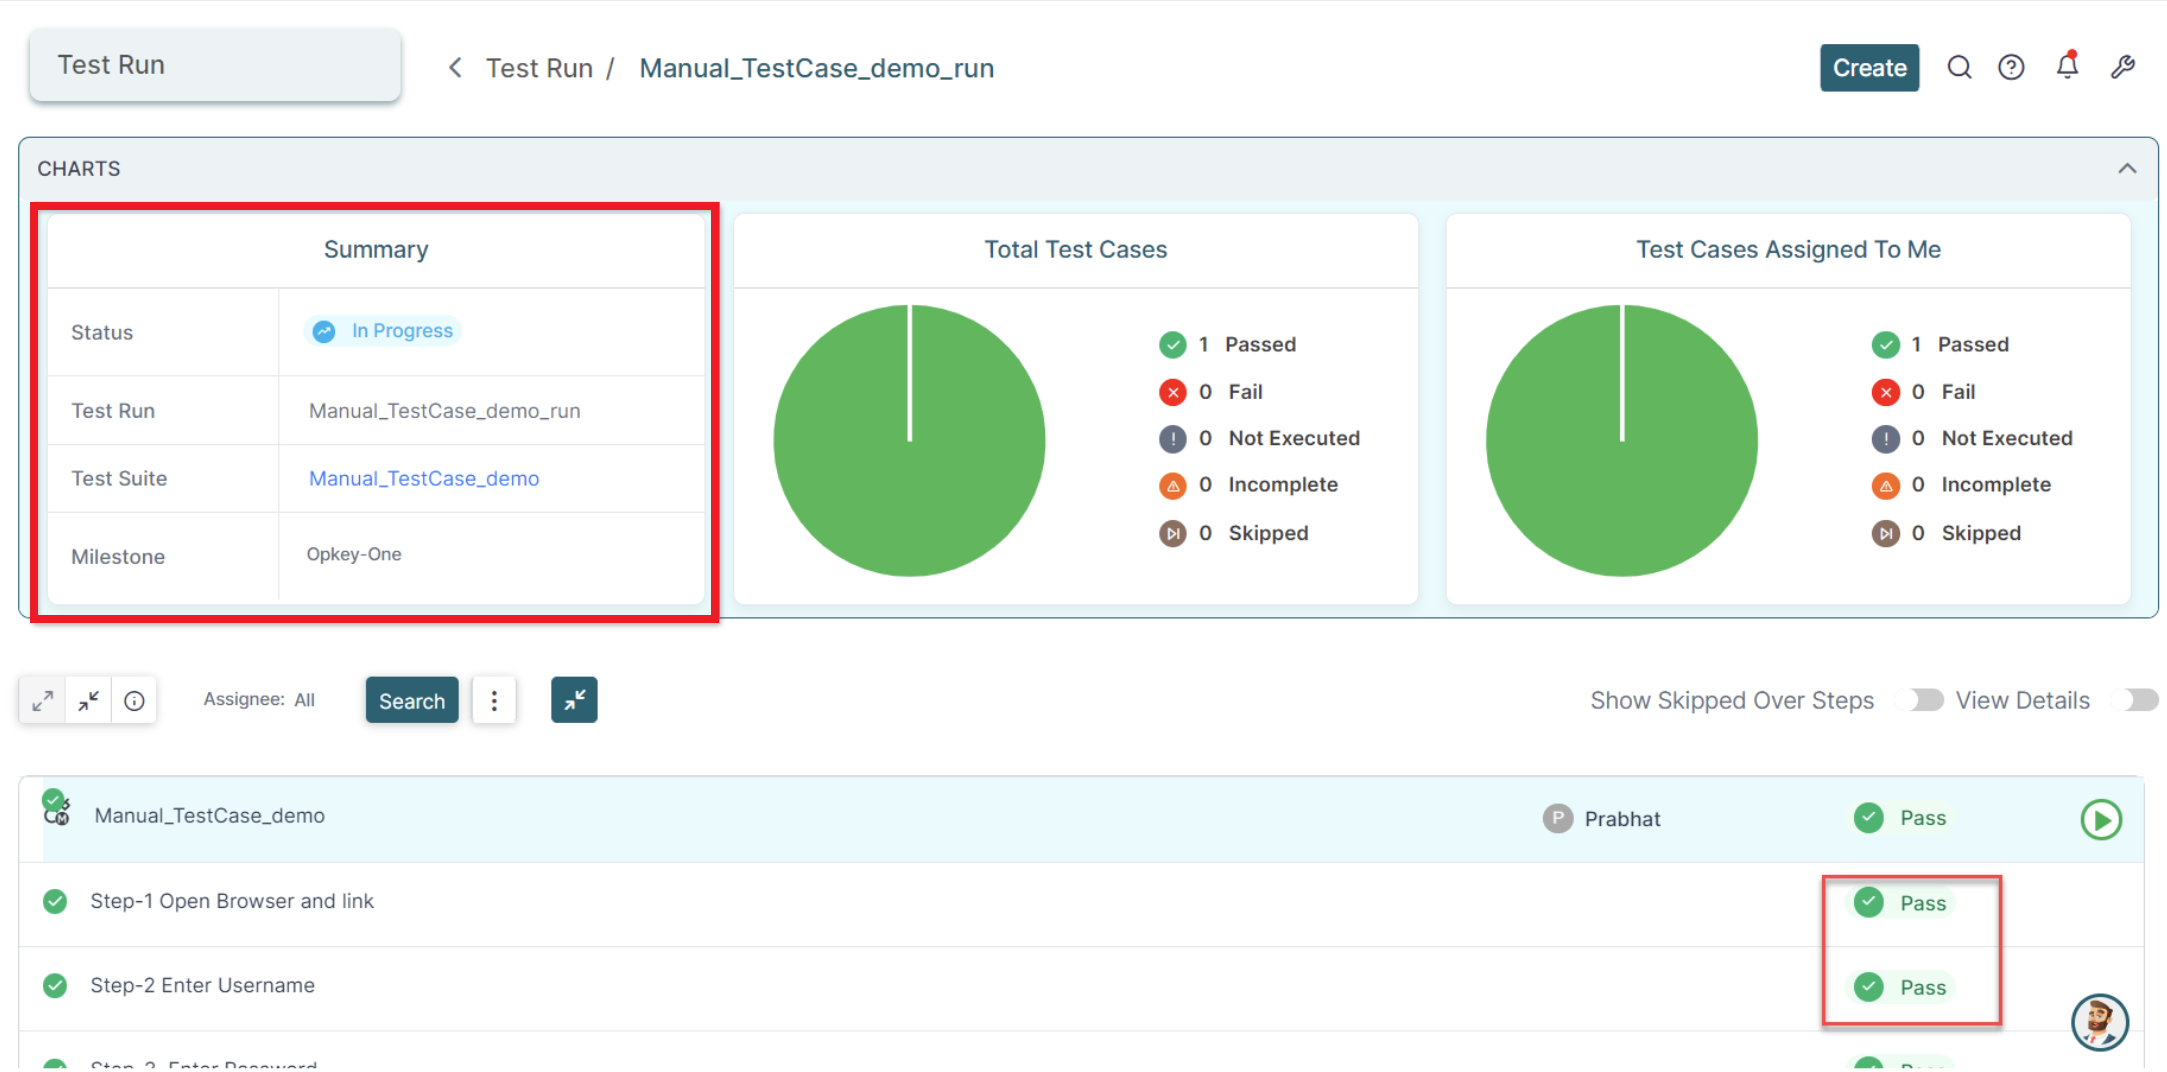
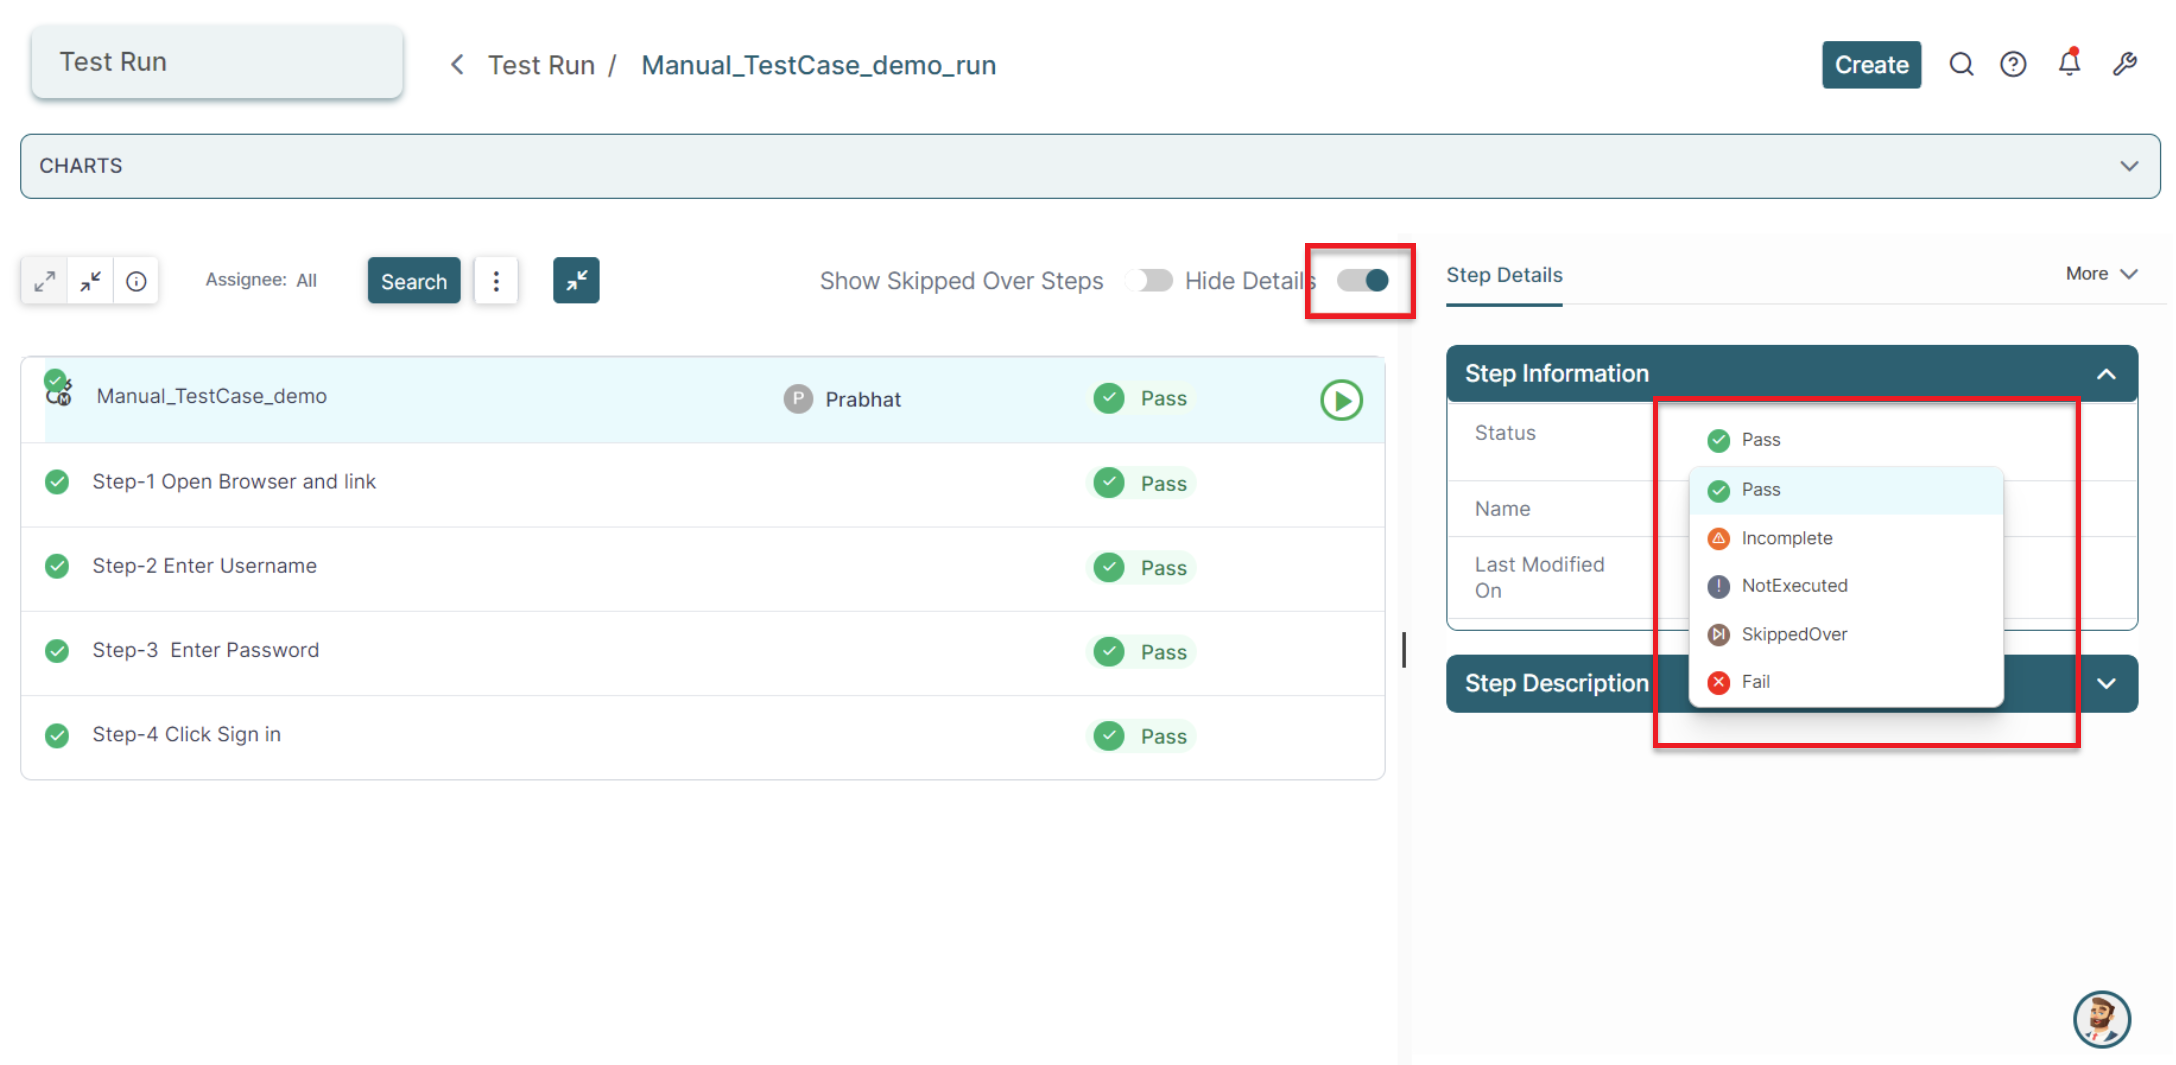
We can see the summary of test results at the top and the result of each test step on the right.
-
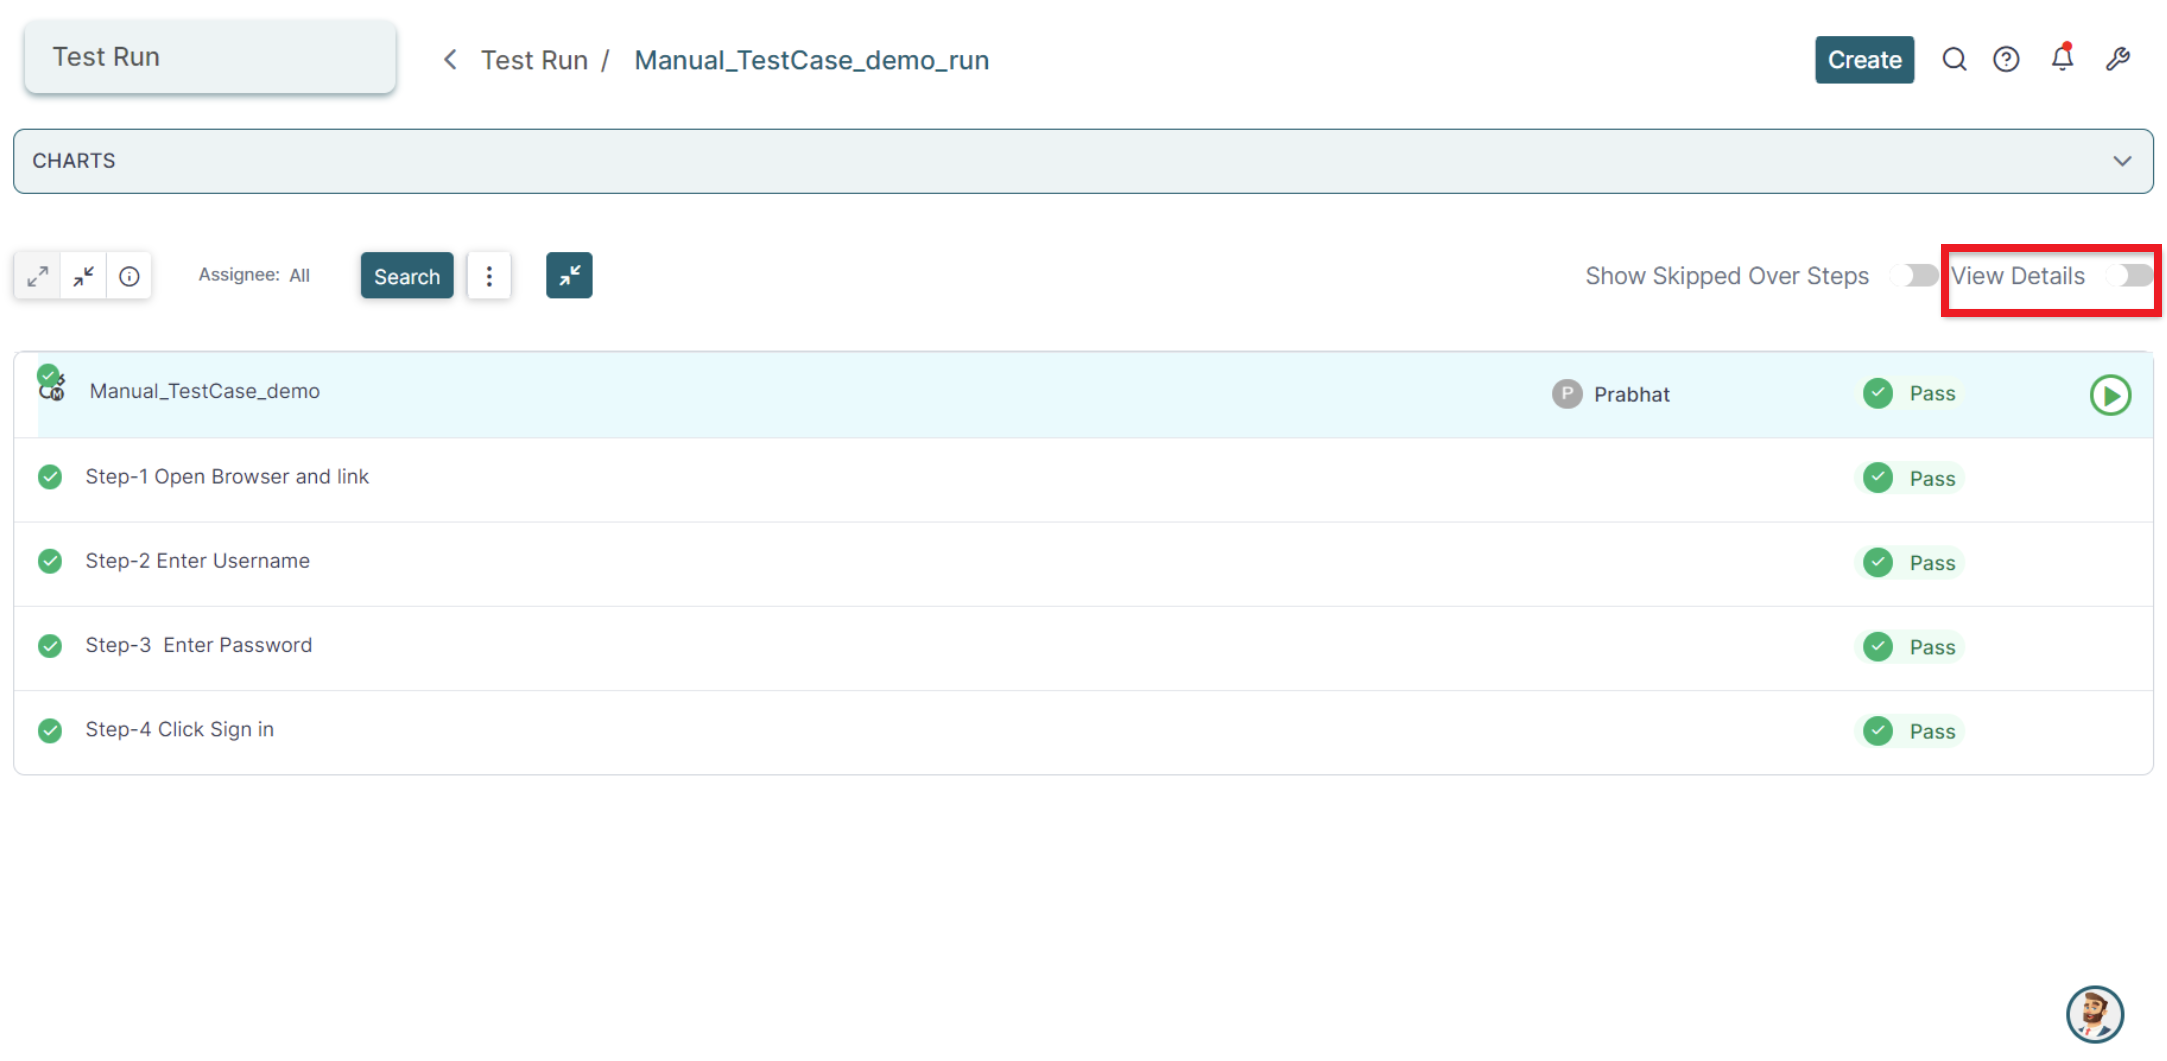
Click the View Details button at the top right corner to open the Step Details panel on the right.
-
You can manually change the status of the step execution by selecting it from the dropdown in the Step Information widget on this page.
You've reached the end of this article and are now well-prepared to analyze test execution results of automated and manual test cases.
Explore, experiment, and achieve your testing goals with Pcloudy!