
Last updated on : 09 Jan 2026
Pcloudy Progressive Reports
Overview
Progressive reports is a new feature that allows users to view the status of their testing statistics in real-time. This feature will allow you to view the status of the Builds and test sessions in real time to make more informed decisions about testing tasks. This documentation will give you an overview of the Dashboard interpretation of various icons and terminologies in the feature and also provide you with the steps to enable the Progressive Report feature.
Pre-requisites
-
User should be registered on Pcloudy platform
-
In Appium capabilities, apart from existing capabilities user needs to mention the additional capabilities mentioned below
- capabilities.setCapability("project", "Project_name");
- capabilities.setCapability("build", "build_name");
- capabilities.setCapability("name", "testcase_name");
- capabilities.setCapability("tag", "newtag");
-
Note: The build and project capabilities help to organise the test sessions.
-
For Beta version (use this endpoint URL in the script) - https://device.pcloudy.com/progressive/wd/hub
Steps for execution :
In your appium script you will need to add these capabilities and execute the scripts.
View test results
Once the user starts the appium execution, the user can view the real time status of the test execution.
Login to Pcloudy platform, Go to the “REPORT” page and click on the Progressive Report icon as shown below.
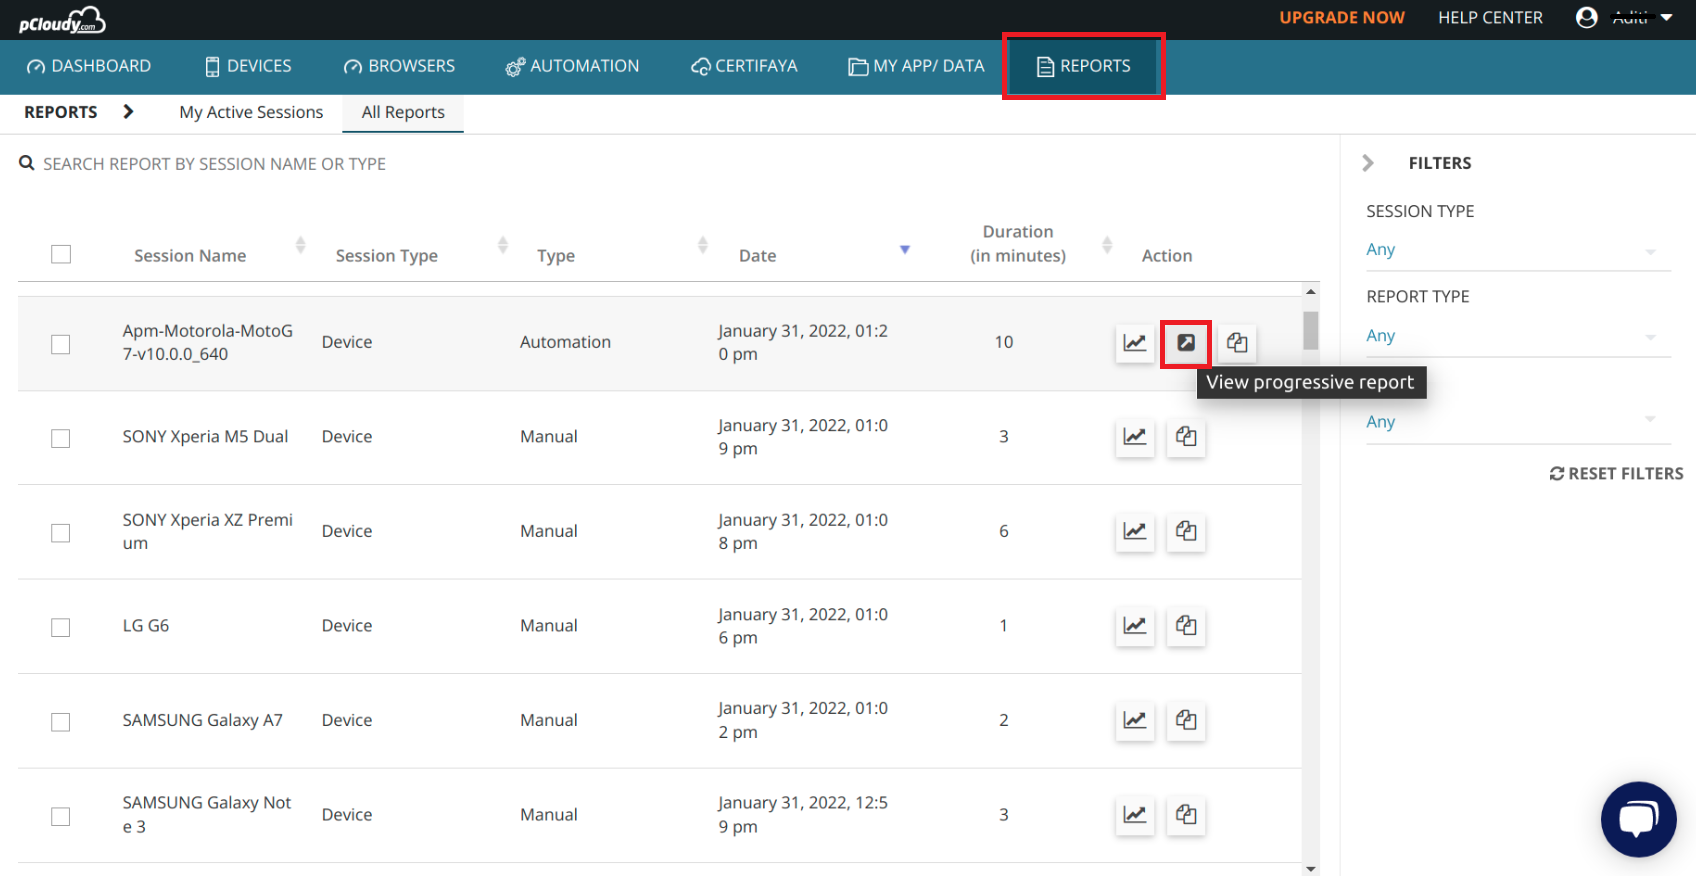
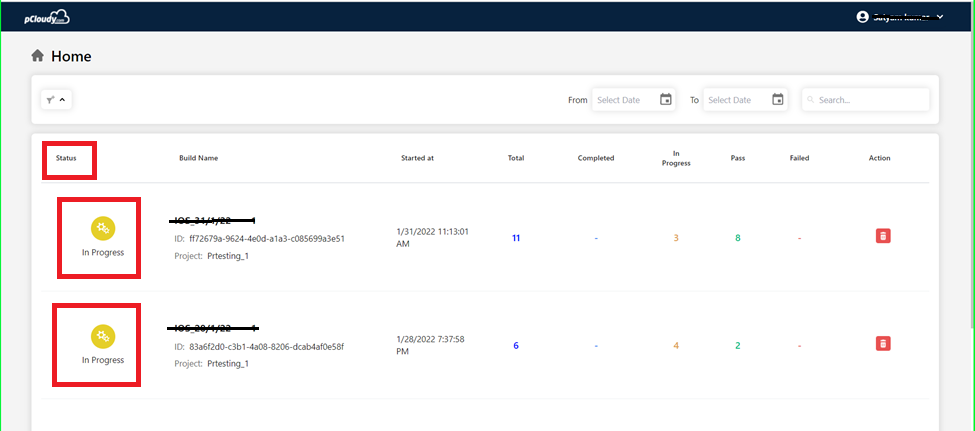
This will lead you to the dashboard page, where you can view the real time status of all Builds that are in progress and also the Builds that are completed. As per requirement, the User can filter the builds by - Build Status or Project Name. Users can also search by the Build Name or Build ID.
Interpreting build status
The status of a Build depends on the status of executed sessions in the build.
- Progress : If the status of one or more test sessions is running.
- Completed : If the status of all test sessions in the build is completed.
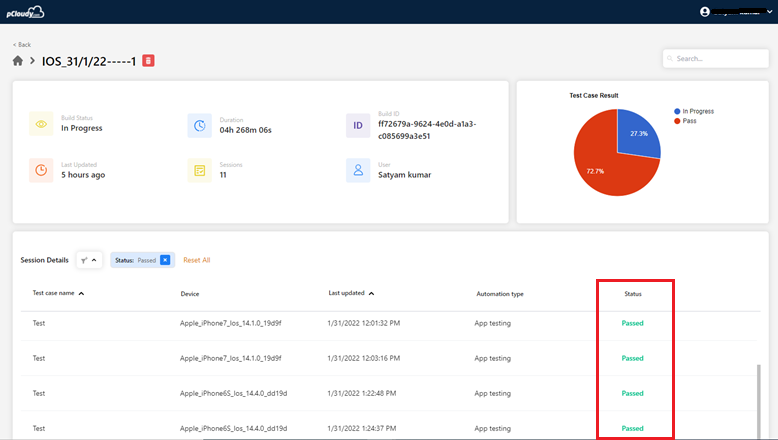
Once a Build is selected, the user can view the overall summary of the Build as well as the results for each test session. Which consists of the Build Detail, No of sessions in the build, the current status and the Overall TestCase result.
The user can then drill down into the details of a specific test session to view its execution details and debugging information such as video recording, network logs and device logs.
Here by using filter user can filter session by Status, Device, Tag and OS Version
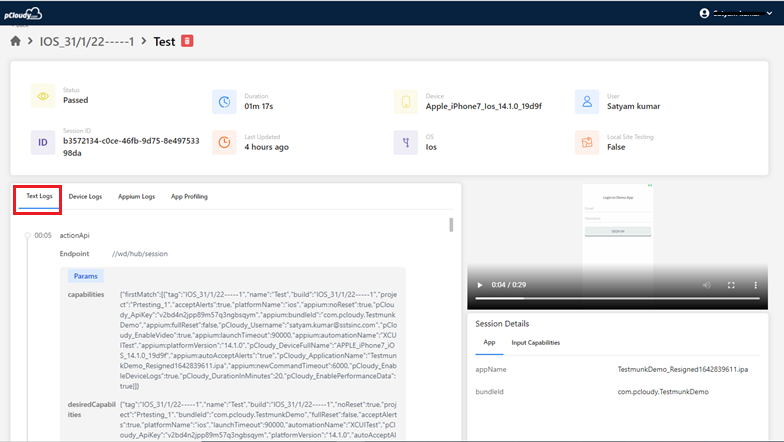
Session detail page - It consists of the session meta-information such as
- Session Status
- Session ID
- Duration
- Last Updated
- Device
- OS Version
- Local Site
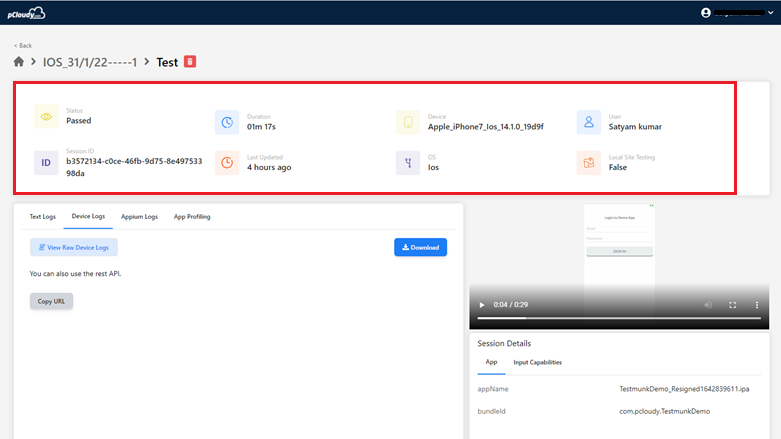
Every Appium test session has a unique session ID associated with it. The user can also use the session ID to access test results and debugging information.
Interpreting test session status
Each test session can have one of the following status:
-
In Progress : Test session is currently running.
-
Pass: Number of passed test cases
One can mark the status using the command “Pcloudy_setResult”Example
driver.executeScript("Pcloudy_setResult", “pass”); -
Fail: Number of Failed test cases
One can mark the status using the command “Pcloudy_setResult”Example
driver.executeScript("Pcloudy_setResult", “fail”); -
Completed: If the user doesn't set the status in the script, it will appear as completed
Use this below mentioned code in your script @AfterMethod to check pass and fail status
public void endTest(ITestResult result) throws IOException, InterruptedException
      {
      String status = result.isSuccess() ? "pass" : "Fail";
      System.out.println("status of the test case"+ status);
      driver.executeScript("Pcloudy_setResult", status);
      driver.quit();
      }
Progressive Report Logs
There are different types of logs such as Text logs, Device logs, Appium logs, App profiling, and Video.
Text Logs
Text logs are enabled by default, and cannot be disabled. Text logs provide detailed information about every request and response that is received.
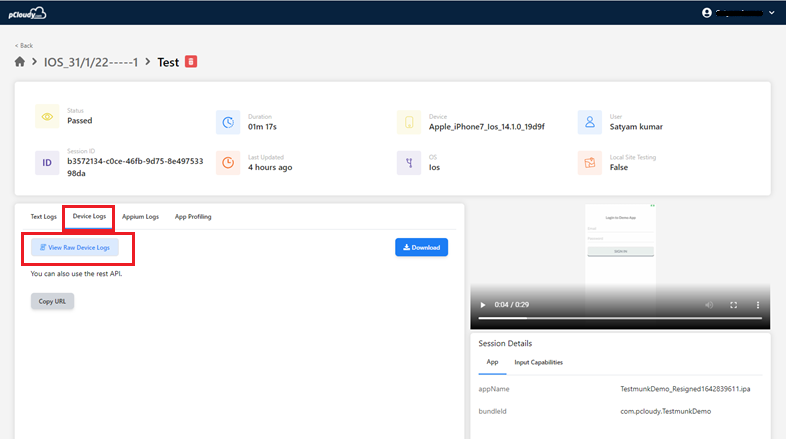
Device Logs
Device logs are system logs specific to your application generated by iOS or Android. They can help you access your application logs and are especially helpful if the application under test crashes during test execution.
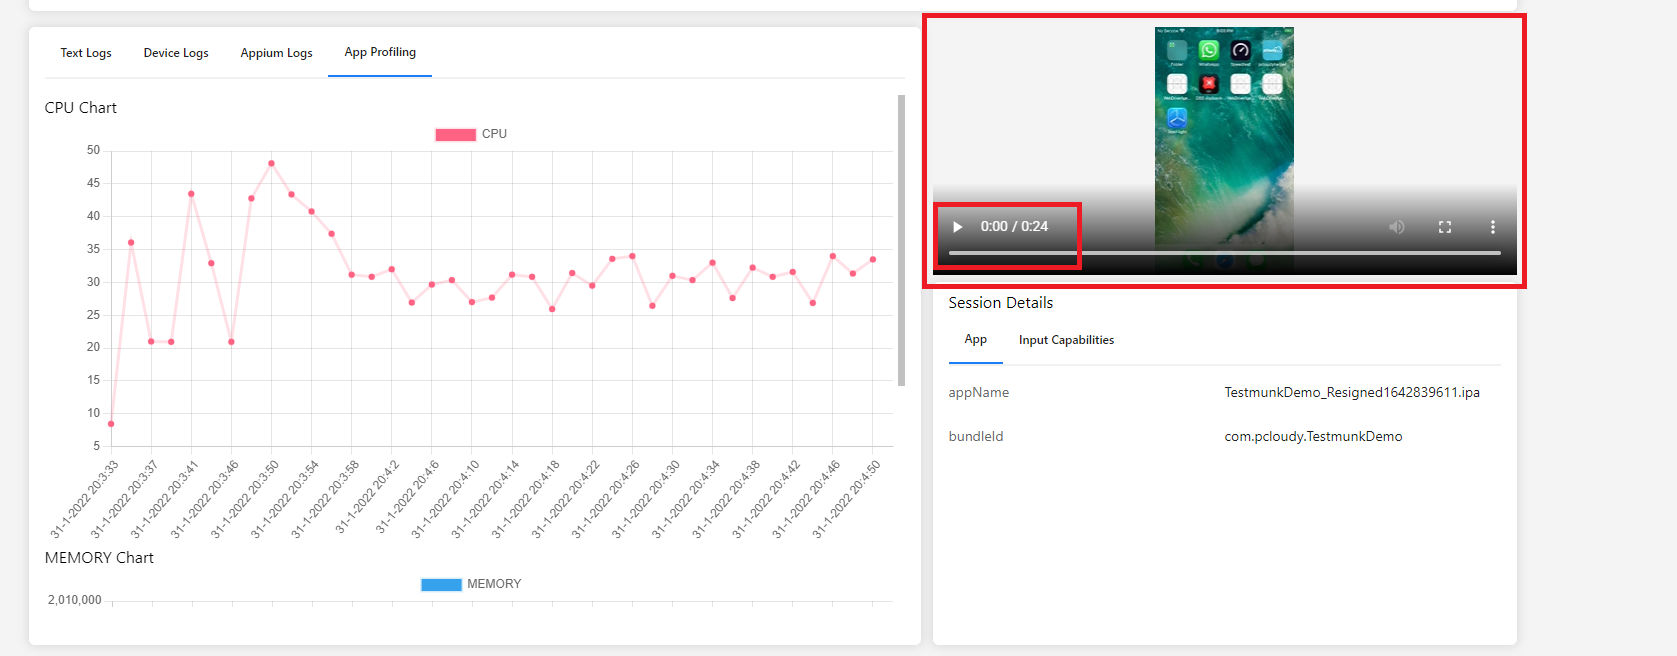
Video Streaming
You can even stream the video of the execution on the devices in real time. you can simply hover over the video section and select play to start viewing the real time video stream of the execution. You can even download the video once the test execution is completed.
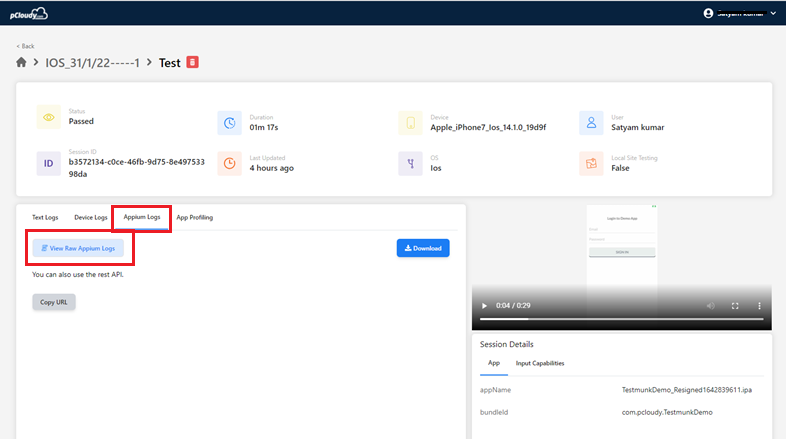
Appium Logs
Appium logs are generated by the Appium server and contain a detailed record of your Appium test session execution. They can help you troubleshoot any errors if your test session fails. Appium logs are enabled by default.
App profiling
App profiling is related to App performance. An app is considered to have poor performance if it responds slowly, freezes/crashes, or consumes a lot of power. To avoid any performance problems, users can make use of App profiling to track where the app is making inefficient use of resources, such as the CPU, memory. App profiling provides graphical charts to monitor app performance or also provide info on the inefficient use of device resources. Optimizing your app’s CPU usage has many advantages, such as providing a faster and smoother user experience and preserving device battery life. Track the CPU usage(%) by your app on the real devices.
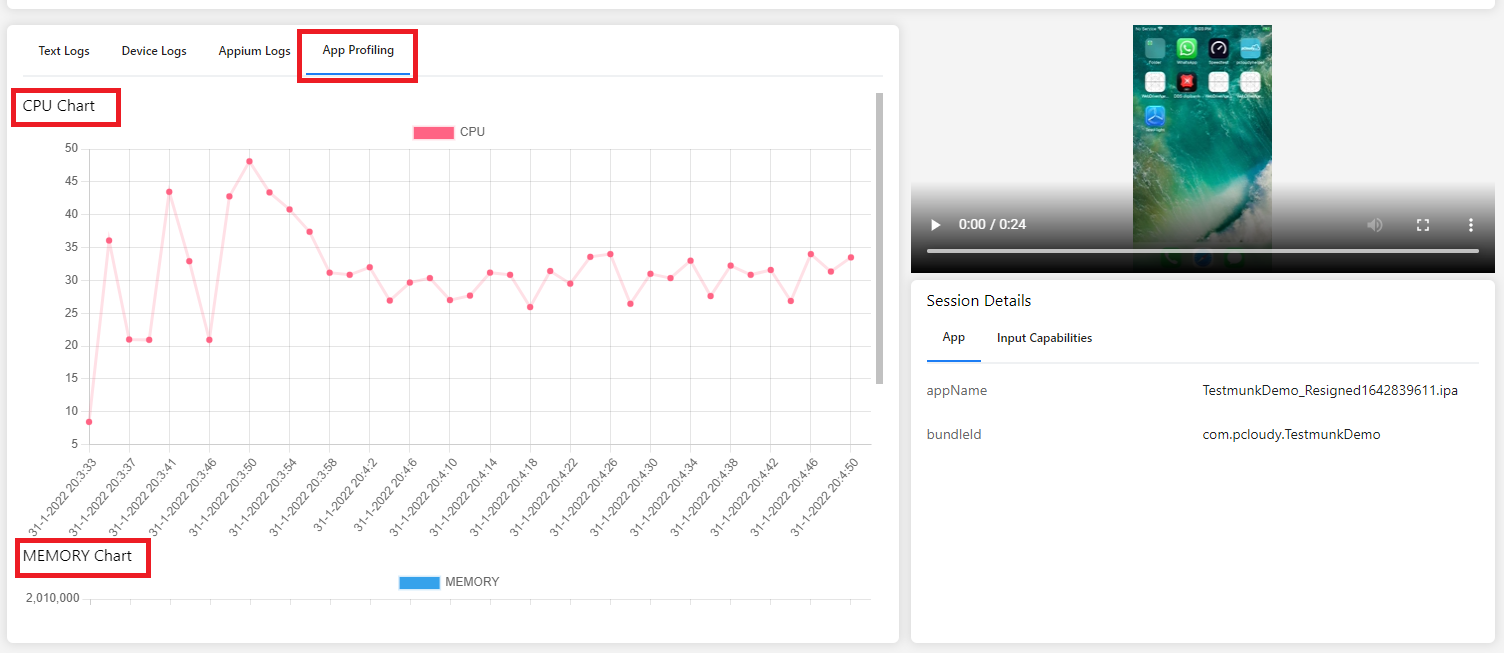
Memory consumption
Identify memory leaks or memory churn that can lead to app freezes, and even app crashes. Track the memory usage (MB) by your app on the real devices.
Did this page help you?