What is Pcloudy?
+
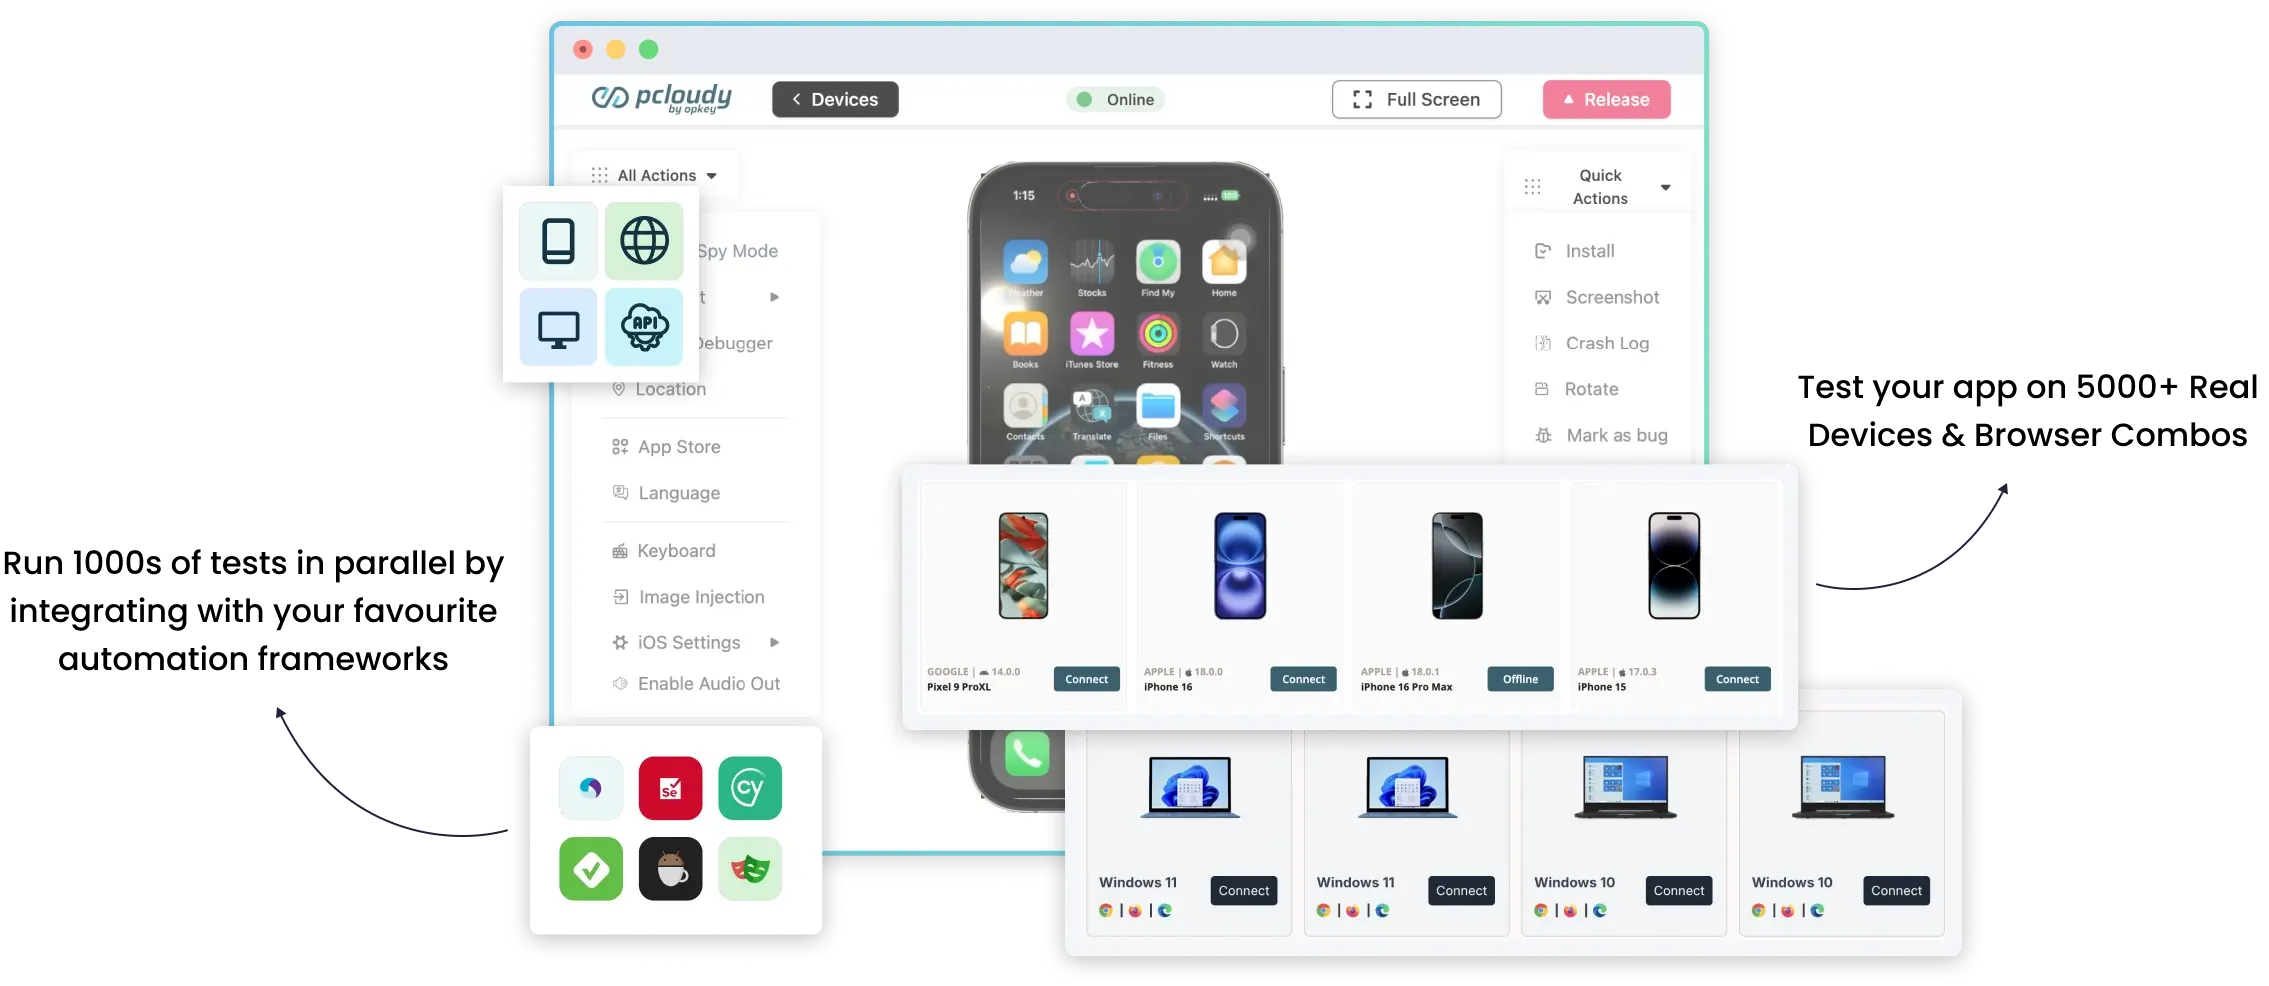
Pcloudy is an AI-powered web and mobile app testing platform that helps enterprises deliver flawless digital experiences. It combines real device cloud access, automated testing, and performance monitoring into a single unified testing platform, making it ideal for agile QA and engineering teams.
How does it help my QA team?
+
Pcloudy empowers QA teams with a test automation platform that supports faster release cycles, broader test coverage, and deeper insights. With tools for automated browser testing, mobile automation, and website testing, teams can quickly identify and resolve issues across all devices and browsers, reducing time-to-market and improving app quality.
Does Pcloudy offer dedicated or private cloud environments for enterprise clients?
+
Yes, Pcloudy provides dedicated and private cloud environments tailored for enterprise-grade needs. This enables organizations to run tests securely using our cloud testing tool, with full control over data access, compliance, and environment configuration.
How does Pcloudy ensure security and compliance for enterprise testing needs?
+
Security is at the core of Pcloudy’s enterprise testing software. The platform follows industry best practices for data encryption, secure access, and regulatory compliance (including GDPR and ISO standards), ensuring enterprise clients can trust the platform for secure web-based testing software usage.
Does Pcloudy integrate seamlessly with popular enterprise tools like Jira, Jenkins, Azure DevOps, and GitHub?
+
Absolutely. Pcloudy’s test automation platform integrates out-of-the-box with popular CI/CD tools like Jenkins, GitHub Actions, Azure DevOps, Jira, and more—allowing for seamless collaboration and faster feedback across the development lifecycle.
What makes Pcloudy's web & mobile app testing platform unique?
+
Pcloudy stands out by combining three key innovations into a single app testing platform:
- AI-driven digital experience testing
- The most diverse real device and browser infrastructure in the market
- Continuous monitoring with proactive issue detection
This makes Pcloudy the go-to solution for browser compatibility testing, mobile testing, and performance analytics at scale.