
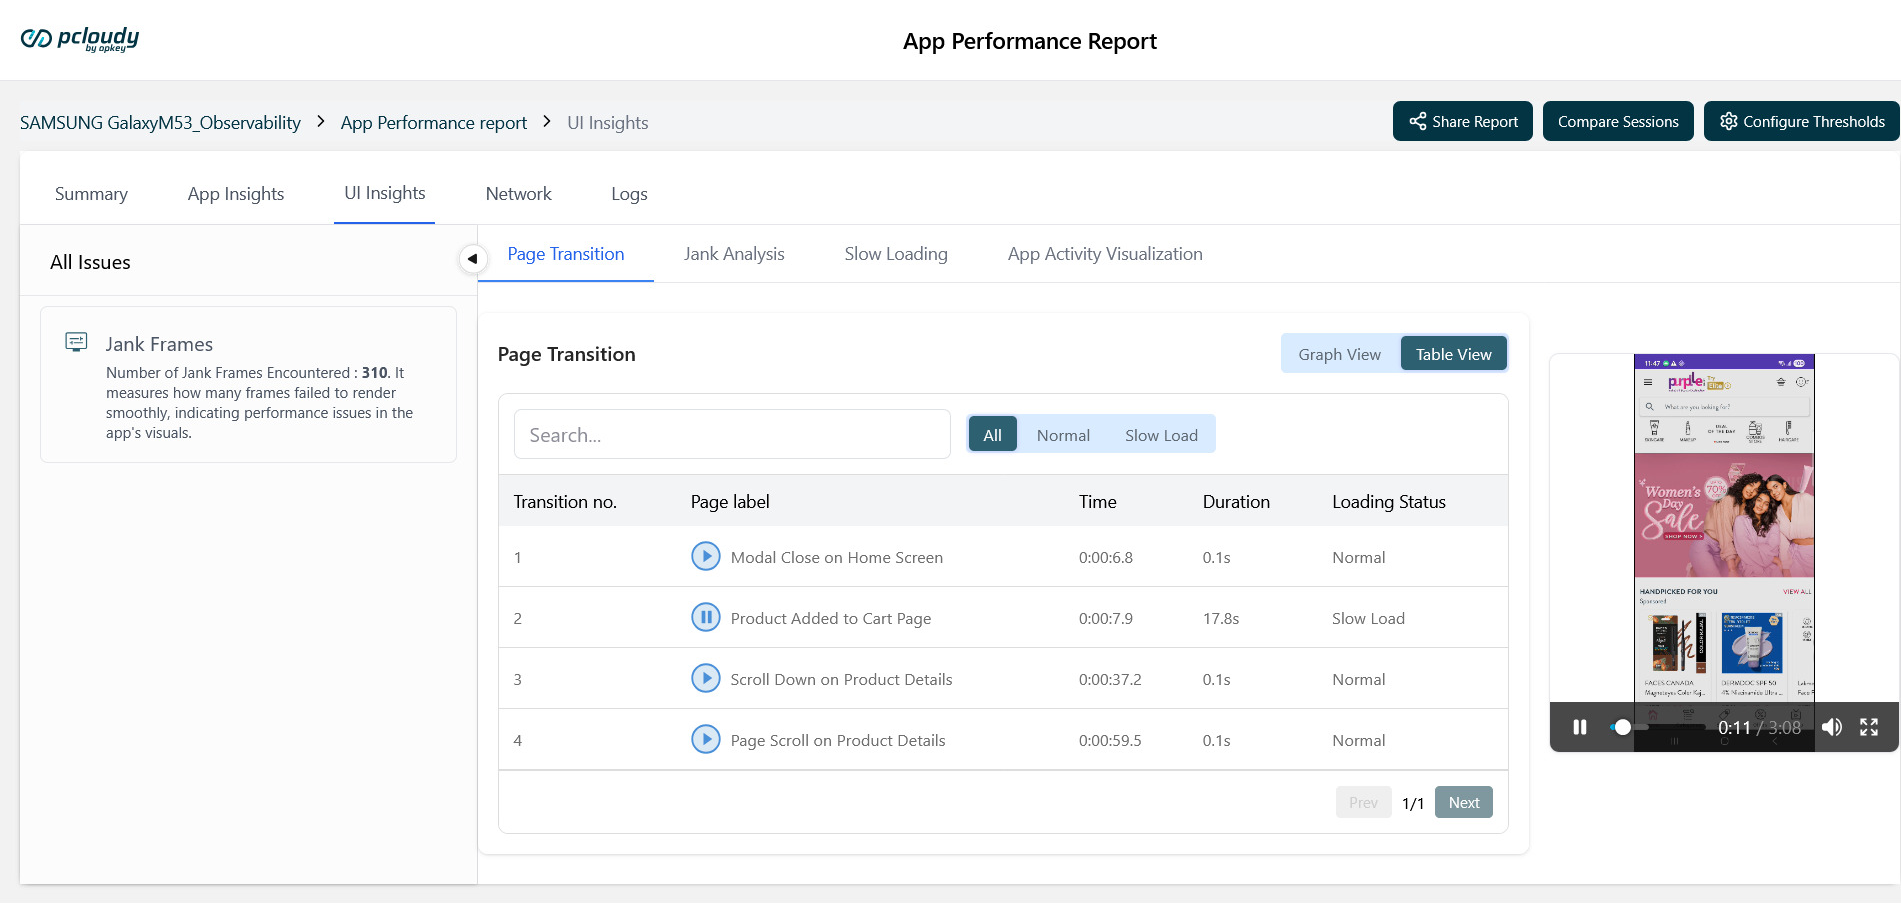
Page Transition — Table View & Session Playback
The Page Transition section within UI Insights provides a detailed breakdown of every screen transition that occurred during an App Performance session. It captures the page label, time of transition, load duration, and loading status — helping developers and QA engineers identify exactly which page transitions are slow or problematic. The data can be viewed in two modes: Table View and Graph View.
Prerequisites
Ensure all of the following conditions are met:
| # | Prerequisite | Details |
|---|---|---|
| 1 | Registered Pcloudy Account | The user must have an active, registered account on the Pcloudy platform. New users can sign up at Pcloudy.com. |
| 2 | App Performance Plan | The account must be subscribed to a plan that includes App Performance testing. Without this plan, the App Performance module and its reports will not be accessible. |
| 3 | App Performance Report Generated | At least one App Performance session must have been executed and a report must be available. |
Feature Screenshots
Table View
UI Insights → Page Transition — Table View with session playback controls
Graph View
UI Insights → Page Transition — Graph View showing duration by transition (Normal Load vs Slow Load)
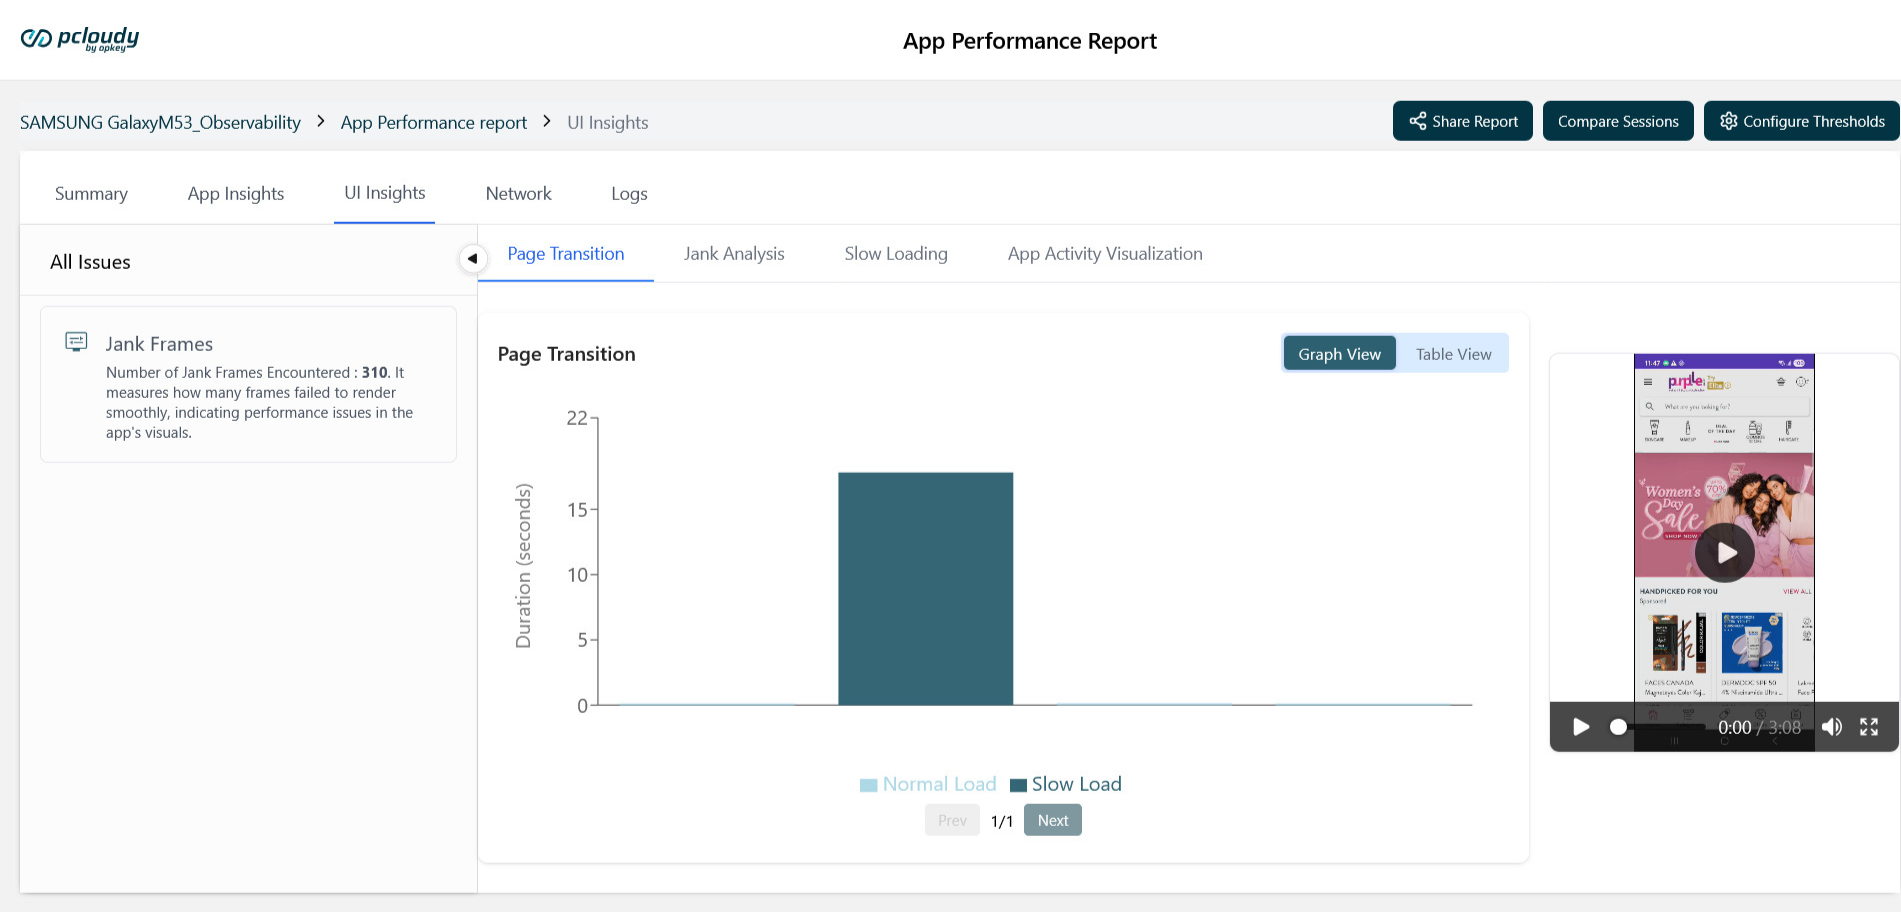
Table View
The Table View displays all detected page transitions in a structured list. Each row represents a single transition recorded during the session.
Table Columns
| Column | Description |
|---|---|
| Transition No. | Sequential number of the transition as it occurred during the session (e.g., 1, 2, 3, 4…). |
| Page Label | The name of the screen or action associated with the transition (e.g., 'Product Added to Cart Page', 'Modal Close on Home Screen'). A play icon (▶ or ⏸) is shown alongside the label. |
| Time | The timestamp within the session at which the transition occurred (e.g., 0:00:7.9 means 7.9 seconds into the session). |
| Duration | The time taken for the page to fully load and render after the transition was triggered, expressed in seconds (e.g., 0.1s = normal, 17.8s = slow load). |
| Loading Status | Indicates whether the transition loaded within the acceptable threshold. Values: Normal (within threshold) or Slow Load (exceeded threshold). |
Search & Filter
- Use the Search bar to find a specific page label by typing part of the transition name.
- Use the filter tabs to narrow the list:
- All — Shows all transitions regardless of loading status.
- Normal — Shows only transitions that loaded within the defined threshold.
- Slow Load — Shows only transitions that exceeded the threshold and are flagged as slow.
- Pagination controls (Prev / Next) at the bottom allow navigation across multiple pages of transition data.
Session Playback — Play Icon
Each row in the Table View includes a play/pause icon (▶ / ⏸) next to the Page Label.
How Playback Works
| Step | Action | What Happens |
|---|---|---|
| 1 | Click ▶ on any row | The session video player on the right side of the screen jumps to the exact timestamp (Time column) of that transition and begins playing. |
| 2 | Video plays | The video shows the app's screen recording from that moment — you can visually observe the page load, any lag, or rendering issues for exactly that transition. |
Why This Matters
The play icon removes the need to manually scrub through the full session video to find the moment a slow transition occurred. By clicking directly on a row — especially a Slow Load row — you can immediately watch the exact moment the app struggled to render, making it faster to diagnose UI performance issues.
Note: Start by filtering to 'Slow Load' to isolate problematic transitions, then click the play icon on each Slow Load row to visually verify the issue in the session video. This combination makes root-cause identification significantly faster.
Graph View
Switching to Graph View presents the same Page Transition data as a bar chart, with Duration (seconds) on the Y-axis and each transition plotted as a bar.
| Element | Description |
|---|---|
| Y-Axis | Duration in seconds. Taller bars indicate longer load times. |
| Bar Colour — Normal | Light teal bars represent transitions with a Normal loading status (within threshold). |
| Bar Colour — Slow Load | Dark teal/blue bars represent transitions flagged as Slow Load. These stand out visually to draw attention to performance outliers. |
| Legend | A colour legend at the bottom of the chart identifies Normal Load vs. Slow Load bars. |
| Toggle | Switch between Graph View and Table View at any time using the buttons in the top-right of the Page Transition panel. Both views show the same underlying data. |
Loading Status — Normal vs Slow Load
The Loading Status is determined by comparing each transition's Duration against the configured threshold. Thresholds can be customised using the Configure Thresholds button in the top-right action bar of the report.
| Status | Condition | Indication |
|---|---|---|
| Normal | Duration is within the defined threshold | Page loaded acceptably — no performance concern for this transition. |
| Slow Load | Duration exceeds the defined threshold | Page took longer than expected to load — investigate this transition using the play icon to view the session recording. |
Important Note:
Threshold Config Default thresholds are pre-set by Pcloudy. To customise them for your app's performance benchmarks, click Configure Thresholds in the top-right of the App Performance Report page.
Did this page help you?