Different Techniques Of Debugging Selenium Based Test Scripts
Writing and maintaining the test automation code is not always a piece of cake. As a matter of fact, we frequently face many scenarios where automated test cases don’t work as expected and might lead to false positive or false negative results, in such cases, debugging is the only way out. Debugging is the primary skill set that an automation tester must adopt. It increases the morale and confidence in automation testers to provide a better code solution to fix the problem permanently.
Debugging issues in the test automation framework becomes more complicated when the test automation framework has a huge number of test cases. With the expansion of features in the application, the number of test cases gradually increases. In such a scenario, fixing complex issues of hybrid frameworks might require enhanced techniques of debugging. In this article, we will deep dive into such essential debugging techniques that will not only fix script issues easily but also save a good amount of debugging time.
What is Debugging?
In simple terms, debugging is a process of software engineering to identify and resolve an error in the source code by adopting various debugging techniques. Debugging is basically divided into four common stages:
- Identification: The first step of debugging is to discover the issue and try reproducing the same in the local system to know why the issue occurred. This is an important step as we need to identify the root cause of the issue to deploy a permanent solution.
- Isolation: Is the second step where the idea is to separate the buggy code from the healthier code. The unit testing of buggy code is required to identify the steps that need to be performed to fix the issue. Isolation of buggy code would further reduce time and not affect the other code.
- Resolution: This is the primary step towards fixing the buggy code. This stage is dependent on the above two mentioned stages, the resolution can be deployed as soon as the above two stages are completed. Few tips for fixing the code:
- Deep dive into the code and libraries being used to get an understanding about the working of the framework
- Refer the proper document and solutions on StackOverflow
- Execute the code in debug mode
- Perform code walkthrough and unit testing in the local system
- Refactor or re-design the framework architecture in the worst case scenario
- Review: This is the final stage of debugging that developers usually try to skip. Reviewing is done to ensure that the fix deployed is working fine and not hampering the other code. Ideally, the review should be done by both i.e the developer who actually fixed the buggy code and by the other developer who is responsible for reviewing and giving a green signal for code merge.
Various Techniques Of Debugging Test Automation Scripts
The number of automated test cases does not always work smoothly, as a matter of fact, the change in UI of an application or change in business logic of an application can ruin the execution of Selenium based test scripts. The reason for test script failure is not always a buggy code in the test automation framework, but can also fail due to the bug found in the application itself. Hence, the proper use of assertions is mandatory to identify the basic reason for test case failure before moving to an advanced level of debugging.
Whenever we are developing the Selenium Test Automation framework from scratch, it is important to have utilities imported to help improve the debugging of source code. At the time of failures, it becomes very challenging to debug the buggy code with the usual java console output. To overcome such challenges, let’s have a look at the debugging techniques that can make developers life easy:
1. Debugging With Logging Utilities
Logging utilities help developers to output a variety of logs as per the target. In case of issues in the test scripts, the logging can be enabled to identify the exact location of buggy code.
Let’s consider an example of Log4j logging framework. This is a Java based open source framework and can be used for logging purposes by just importing the maven dependency.
Now let’s have a quick look at the different component of Log4j:
- Loggers : It contains all the information about the logging level. Loggers offer different severity levels for logs. The initial step is to create an object of Logger class:
Logger logger = Logger.getLogger(“ClassName”);
There are 5 kinds of severity log levels that Logger provides:
- All
- Debug
- Info
- Warn
- Error
- Fatal
- Off
- Appenders : The logs that have been generated with the above mentioned types of severity log levels have to be pushed to the destination to view the logs, this role is performed by appenders. It sends the log events to the destination folder or prints on console as per the configuration done. There are three types of appenders available to output the logs:
- ConsoleAppender
- FileAppender
- Rolling File Appender
- Layouts : Layouts provide different methods for formatting of the logs. The logging information can be formatted in different formats with the below provided methods:
- Public static Logger getRootLogger()
- Public static Logger getLogger (String name)
Download a free poster of the Debugging Techniques for Selenium based Test Scripts
Download the Debugging Poster Now!
2. Capturing Screenshots
Usually when we execute our regression or smoke test suite, we don’t observe the execution for long hours. Hence, we would always want to know where exactly the test case failed so that we can take the necessary steps towards fixing the issue. The idea that can be adopted to fulfill such a case is to capture a screenshot of the webpage at the moment where the test script failed. And later, as a part of debugging, looking at the screenshots we can easily identify where our test method failed.
Selenium provides an interface TakesScreenshot that can be used to capture screenshots of web pages. To get the execution result/status of the test method, we can use the ITestResult interface.
import java.io.File;
import org.apache.commons.io.FileUtils;
import org.openqa.selenium.By;
import org.openqa.selenium.OutputType;
import org.openqa.selenium.TakesScreenshot;
import org.openqa.selenium.WebDriver;
import org.openqa.selenium.WebElement;
import org.openqa.selenium.chrome.ChromeDriver;
import org.testng.Assert;
import org.testng.ITestResult;
import org.testng.annotations.AfterClass;
import org.testng.annotations.AfterMethod;
import org.testng.annotations.BeforeClass;
import org.testng.annotations.Test;
import io.github.bonigarcia.wdm.WebDriverManager;
public class TestScript {
private WebDriver driver;
public String expectedTitle = “This is a wrong title”;
@BeforeClass
public void setup() {
WebDriverManager.chromedriver().setup();
driver = new ChromeDriver();
}
@Test
public void verifyLoginPage() {
driver.get(“https://www.pcloudy.com/”);
WebElement loginButton =
driver.findElement(By.xpath(“//a[text()=’Login’]”));
loginButton.click();
String actualTitle = driver.getTitle();
Assert.assertEquals(actualTitle, expectedTitle,
“Login Page Title didn’t matched with the expected title”);
}
@AfterMethod
public void screenShot(ITestResult result) {
if (ITestResult.FAILURE == result.getStatus()) {
try {
TakesScreenshot screenshot =
(TakesScreenshot) driver;
File src =
screenshot.getScreenshotAs(OutputType.FILE);
FileUtils.copyFile(src, new
File(“/home/ramit/Pictures/” + result.getName() + “.png”));
System.out.println(“Screenshot captured of
failed test case”);
} catch (Exception e) {
System.out.println(“Exception
occured while taking screenshot ” + e.getMessage());
}
}
}
@AfterClass
public void tearDown() {
driver.quit();
}
}
3. Session Recording
This is another advanced way of debugging. As the execution time of a regression suite is too long, it is difficult to sit tight and observe the entire execution of the constantly failing test cases. In such cases we can enable the session recording and save it for future debugging purposes. Many times, the test cases failing in the regression suite aren’t reproducible when executed as a single class, in such scenarios, test session recordings are the best way out. With this, we can easily visualize and validate the test actions and ensure that no unexpected alerts and elements are popping up.
Session recording is an enhanced level debugging comparative to logs or screenshot capturing but it is probably useful when the test suite contains a huge number of test cases. With the session recording, we can also get to know about the server performance and UI usability, and can also be shared with developers in case the bugs are found in the production/staging environment to replicate the bug easily.
Since there is no direct support from Selenium to record test sessions, you may use a third party tool like Monte Media Library. If you want to skip writing the code to record selenium sessions, you can also install third party software in your physical machine for screen recording like SimpleScreenRecorder, this also provides a feature to schedule the recording.
4. Adding Breakpoints
Breakpoints are a part of IDE that can temporarily halt the execution of the code. Once the execution gets paused at the breakpoint, we can acquire data of the essential elements in the source code. The debugging with breakpoints can be done easily with the below sequence:
- Set up the breakpoints where buggy code is observed
- Execute the source code in debug mode
- Validate the data returned in debugger
- Resume the debugging if multiple breakpoints are added
- Stop the debug mode execution
- Fix error and deploy the code

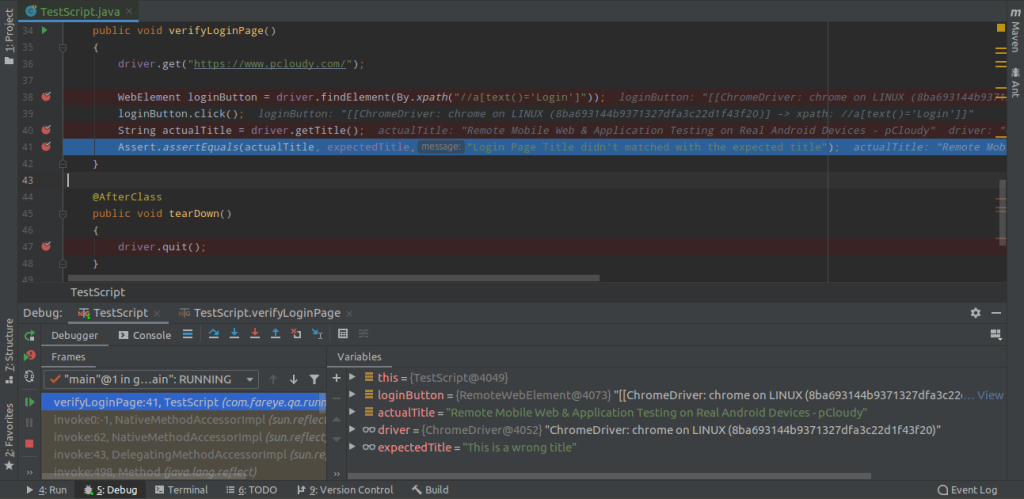
The above is a screenshot of the Intellij IDE in which 4 breakpoints are added. The checkmarks appear on the added breakpoints at run-time as soon as the breakpoint is recognized by the debugger. In case multiple breakpoints are added in the code, the execution can be resumed by pressing F9 to acquire data from different breakpoints.
Debugging with breakpoints leverages automation testers to fix the issues in interactive mode.
5. Debugging Selenium Tests On Already Opened Browser
Many times it so happens that only the last few steps of the test method are observed as constant failures. In such cases, we can fix the buggy code and execute the entire test again. This consumes a lot of execution time and till then we have to sit tight to observe whether the updated code at the end of the test method is working fine or not.
To overcome this situation, we can debug selenium based test scripts on an already opened browser. Firstly, we can launch the browser manually and perform the web actions manually that works fine with the test script and then execute only the buggy code or fixed/updated code. This would save time in executing healthier code and will only execute the code that needs to be verified.
To achieve this use case, we would be using Chrome DevTools Protocol that allows clients to inspect and debug chrome browsers. To launch chrome on remote debugging port, we need to run below command for Linux:
google-chrome –remote-debugging-port=9222 –user-data-dir=<some directory path>
- For remote debugging port, you can specify any open port.
- For the user data directory, you need to specify the directory where the new chrome profile will be created.
Once you run the above mentioned command on the terminal, the fresh chrome browser should get launched.

Example :
Considering a test of the pCloudy login page, let’s open the pCloudy website manually on this debugging chrome browser and then let’s execute the below script from the next required step.
import org.openqa.selenium.By;
import org.openqa.selenium.WebDriver;
import org.openqa.selenium.WebElement;
import org.openqa.selenium.chrome.ChromeDriver;
import org.openqa.selenium.chrome.ChromeOptions;
import org.testng.Assert;
import org.testng.annotations.AfterClass;
import org.testng.annotations.BeforeClass;
import org.testng.annotations.Test;
import io.github.bonigarcia.wdm.WebDriverManager;
public class TestScript {
private WebDriver driver;
public String expectedTitle = “Remote Mobile Web &
Application Testing on Real Android Devices – pCloudy”;
@BeforeClass
public void setup()
{
WebDriverManager.chromedriver().setup();
ChromeOptions opt = new ChromeOptions();
opt.setExperimentalOption(“debuggerAddress”,
“localhost:9222”);
driver = new ChromeDriver(opt);
}
@Test
public void verifyLoginPage()
{
//driver.get(“https://www.pcloudy.com/”);
WebElement loginButton =
driver.findElement(By.xpath(“//a[text()=’Login’]”));
loginButton.click();
driver.findElement(By.id(“userId”)).sendKeys(“ramit.dhamija@gmail.com”);
String actualTitle = driver.getTitle();
Assert.assertEquals(actualTitle,
expectedTitle,”Login Page Title didn’t matched with the expected
title”);
}
@AfterClass
public void tearDown()
{
driver.quit();
}
}
Code Walkthrough:
Once we have opened the pCloudy website manually on debugging chrome browser, we have then executed the above test script to continue from the same opened browser.
To set up the test on an already opened browser, we have used ChromeOptions setExperimentalOption method to set the experimental option i.e. debuggerAddress. The debugger address would be the same address on which the debugging chrome is launched.
-
Parallel Execution and Debugging
In an era where fast feedback loops are crucial, parallel execution of tests has become an essential practice. Selenium supports running tests in parallel, which helps in significantly reducing the test execution time. However, running tests in parallel can introduce new debugging challenges.
What is Parallel Execution?
Parallel execution involves running multiple tests simultaneously rather than sequentially. This is particularly useful in large test suites, which can take a long time to execute. By distributing the tests across multiple threads or processes, you can cut down the execution time considerably.
Challenges in Debugging Parallel Tests
- Shared Resources: When tests run in parallel, they may access shared resources like files or databases. This can cause conflicts if not managed properly.
- Non-deterministic Failures: Sometimes a test may fail when run in parallel but pass when run alone. These non-deterministic failures are hard to debug.
- Isolation of Logs: When multiple tests are running concurrently, logs can become intertwined, making it difficult to trace which log statements belong to which test.
Strategies for Debugging
- Resource Isolation: Ensure that each test has its own set of resources (e.g., separate database instances, unique file names).
- Thread-Safe Coding Practices: Employ coding practices that are safe for multi-threaded environments. For instance, avoid using static variables that can be accessed by multiple threads.
- Structured Logging: Implement structured logging where each log entry is tagged with the specific test or thread it belongs to. This will help in filtering logs for a particular test.
- Failing Fast: If possible, configure your test runner to stop on the first failure. This makes it easier to focus on debugging the first issue before proceeding.
- Running Tests in Isolation: If a test fails in parallel execution, run it in isolation to determine if the failure is due to parallel execution or an issue with the test itself.
7. Using Selenium Grid for Cross-Browser Testing
Cross-browser testing is an important aspect of ensuring that your web application works consistently across different web browsers and operating systems. Selenium Grid is a powerful tool that allows you to perform cross-browser testing.
What is Selenium Grid?
Selenium Grid is a part of the Selenium Suite specialized in running multiple tests across different browsers, operating systems, and machines in parallel. It has two main components: the Hub and the Nodes. The Hub acts as a central point that will receive the test to be executed along with information on which browser and ‘OS’ configuration it should be run. Nodes are the machines that are attached to the Hub and will execute the tests on the desired browser and platform.
Setting up Selenium Grid
- Download Selenium Server: Download the Selenium Server (Grid) from the Selenium website.
- Start the Hub: Use a command-line tool to navigate to the location of the Selenium Server jar file and start the hub using the command: java -jar selenium-server-standalone-<version>.jar -role hub
- Register Nodes: On each of the node machines, navigate to the location of the Selenium Server jar file and register the node with the command: java -jar selenium-server-standalone-<version>.jar -role node -hub http://<hub-ip>:4444/grid/register
Debugging Strategies
- Browser-Specific Issues: Sometimes, an issue may occur only in a specific browser. You need to identify whether the problem is with the browser’s rendering or with your test.
- Checking Compatibility: Ensure that the Selenium bindings are compatible with the browser versions you are using.
- Log Analysis: Analyze the logs generated by Selenium Grid to pinpoint any issues in communication between the Hub and Nodes.
- Visual Inspection: Sometimes, issues might be due to elements rendering differently on different browsers. Visual inspection helps in these cases.
- Isolate Issues: If a test fails on one of the node machines, try running the test locally on the same browser and OS combination to isolate whether the issue is with the Grid setup or the test.
Conclusion
No matter how careful we are in writing the test cases, there is always a chance that it will fail by either producing false positives or false negatives. Using the right technique to debug these failed test cases becomes a crucial step to leverage automation test scripts. Here we have discussed in detail some of the techniques you can use when debugging Selenium based Test scripts. Learning to write test scripts is vital but knowing how to debug them when it fails is also a much sought after skill. We hope these few tips will help you debug test scripts better and effectively use selenium automation.