
Release Note 8.2
Overview
Pcloudy 8.2 brings a strong focus on making real device testing more accessible, performance insights more shareable, and UI behavior more transparent. With seamless Android Espresso execution on real devices, teams can now trigger test runs effortlessly from their local environment while Pcloudy handles the heavy lifting behind the scenes.
Performance reporting becomes more collaborative with instant shareable links that remove access barriers for stakeholders. At the same time, enhanced UI Insights introduce deeper visibility into screen transitions, helping teams quickly pinpoint performance bottlenecks and optimize user experience with data-driven clarity.
Key Highlights
- Run Android Espresso tests on real cloud devices with a single JSON file and JAR
- Share App Performance Reports instantly via time-limited links — no login required
- UI Insights Page Transition Analysis to identify slow-loading screens
Update 1 — Run Android Espresso Tests Directly on Real Devices
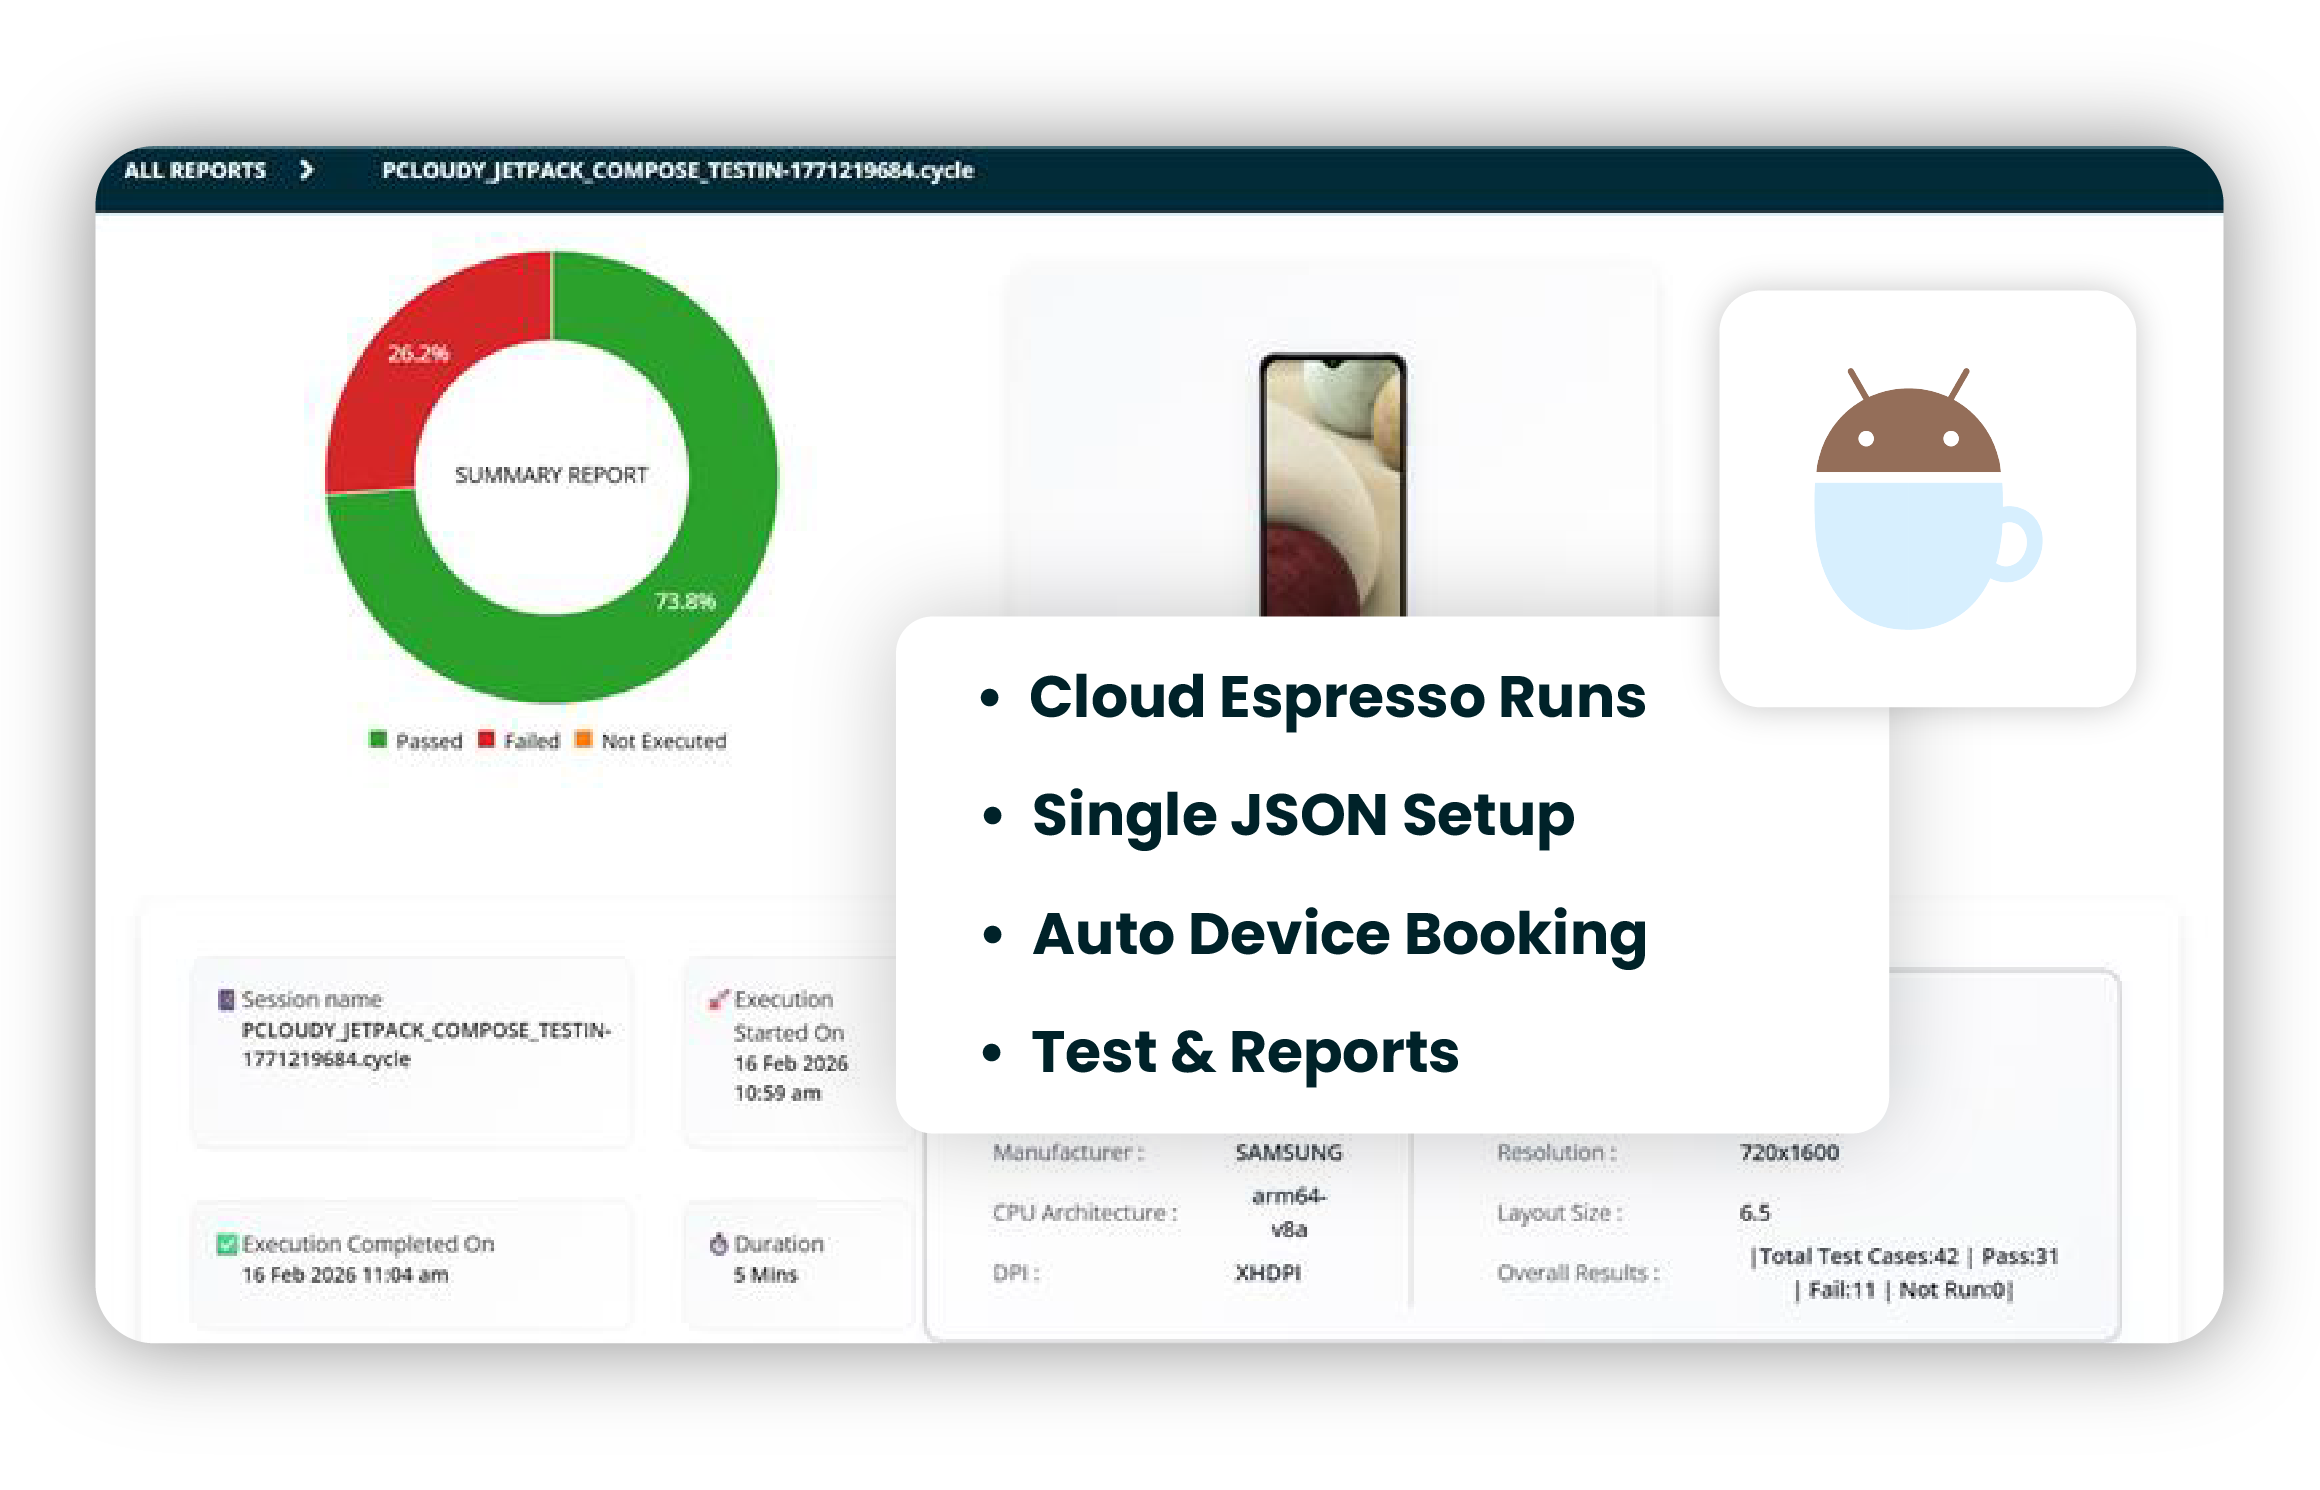
Pcloudy Espresso integration lets teams run Android Espresso tests on real cloud devices directly from their local setup. With a single JSON file and JAR, everything is triggered seamlessly. Pcloudy handles device booking, APK upload, execution, and reporting automatically. This makes real device testing simple, scalable, and easy to integrate into existing workflows.
Key Highlights
- Cloud Espresso Runs
- Single JSON Setup
- Auto Device Booking
- Test & Reports
Update 2 — Share App Performance Reports Instantly
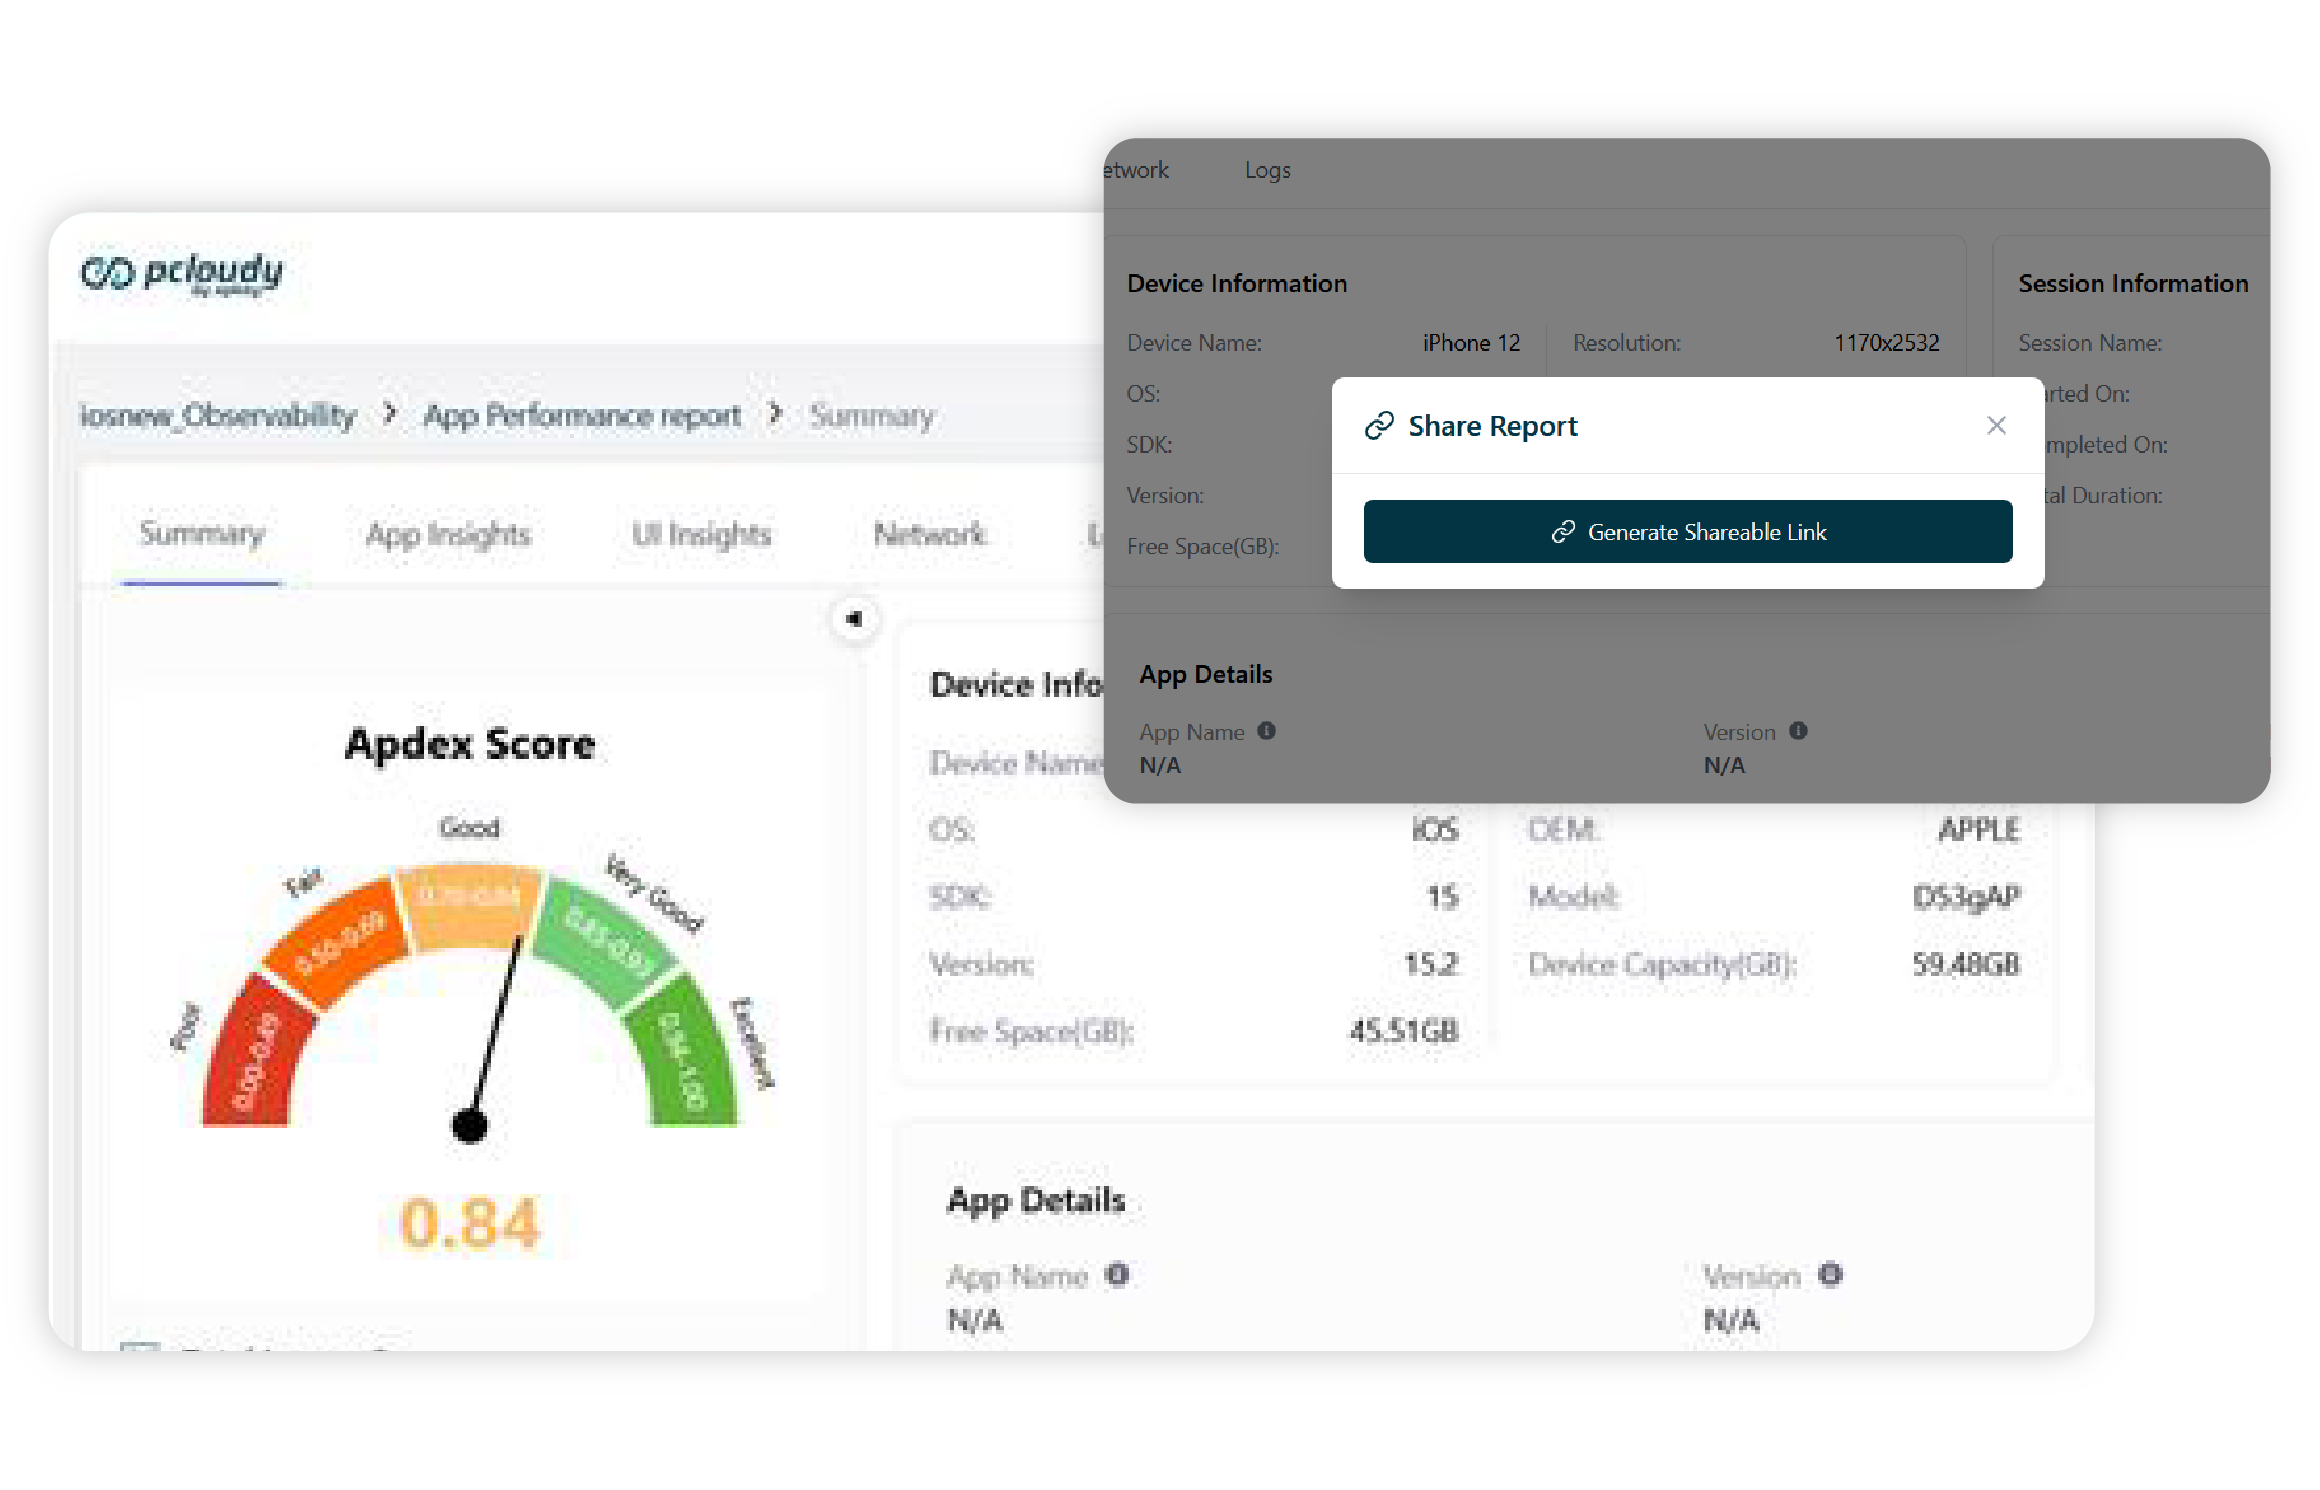
App Performance Reports now support easy sharing across teams and stakeholders. With the new Share Report capability, users can generate a shareable link for any performance session.
This link allows team members, managers, or external collaborators to view the performance report without needing a Pcloudy login. Shared links remain active for 1 day, making it easy to distribute insights during release discussions, performance reviews, or debugging sessions.
Key Highlights
- Generate shareable links for performance reports
- No login required for viewers
- Simplified collaboration across teams
- Secure access with time-limited links
Update 3 — UI Insights Page Transition Analysis
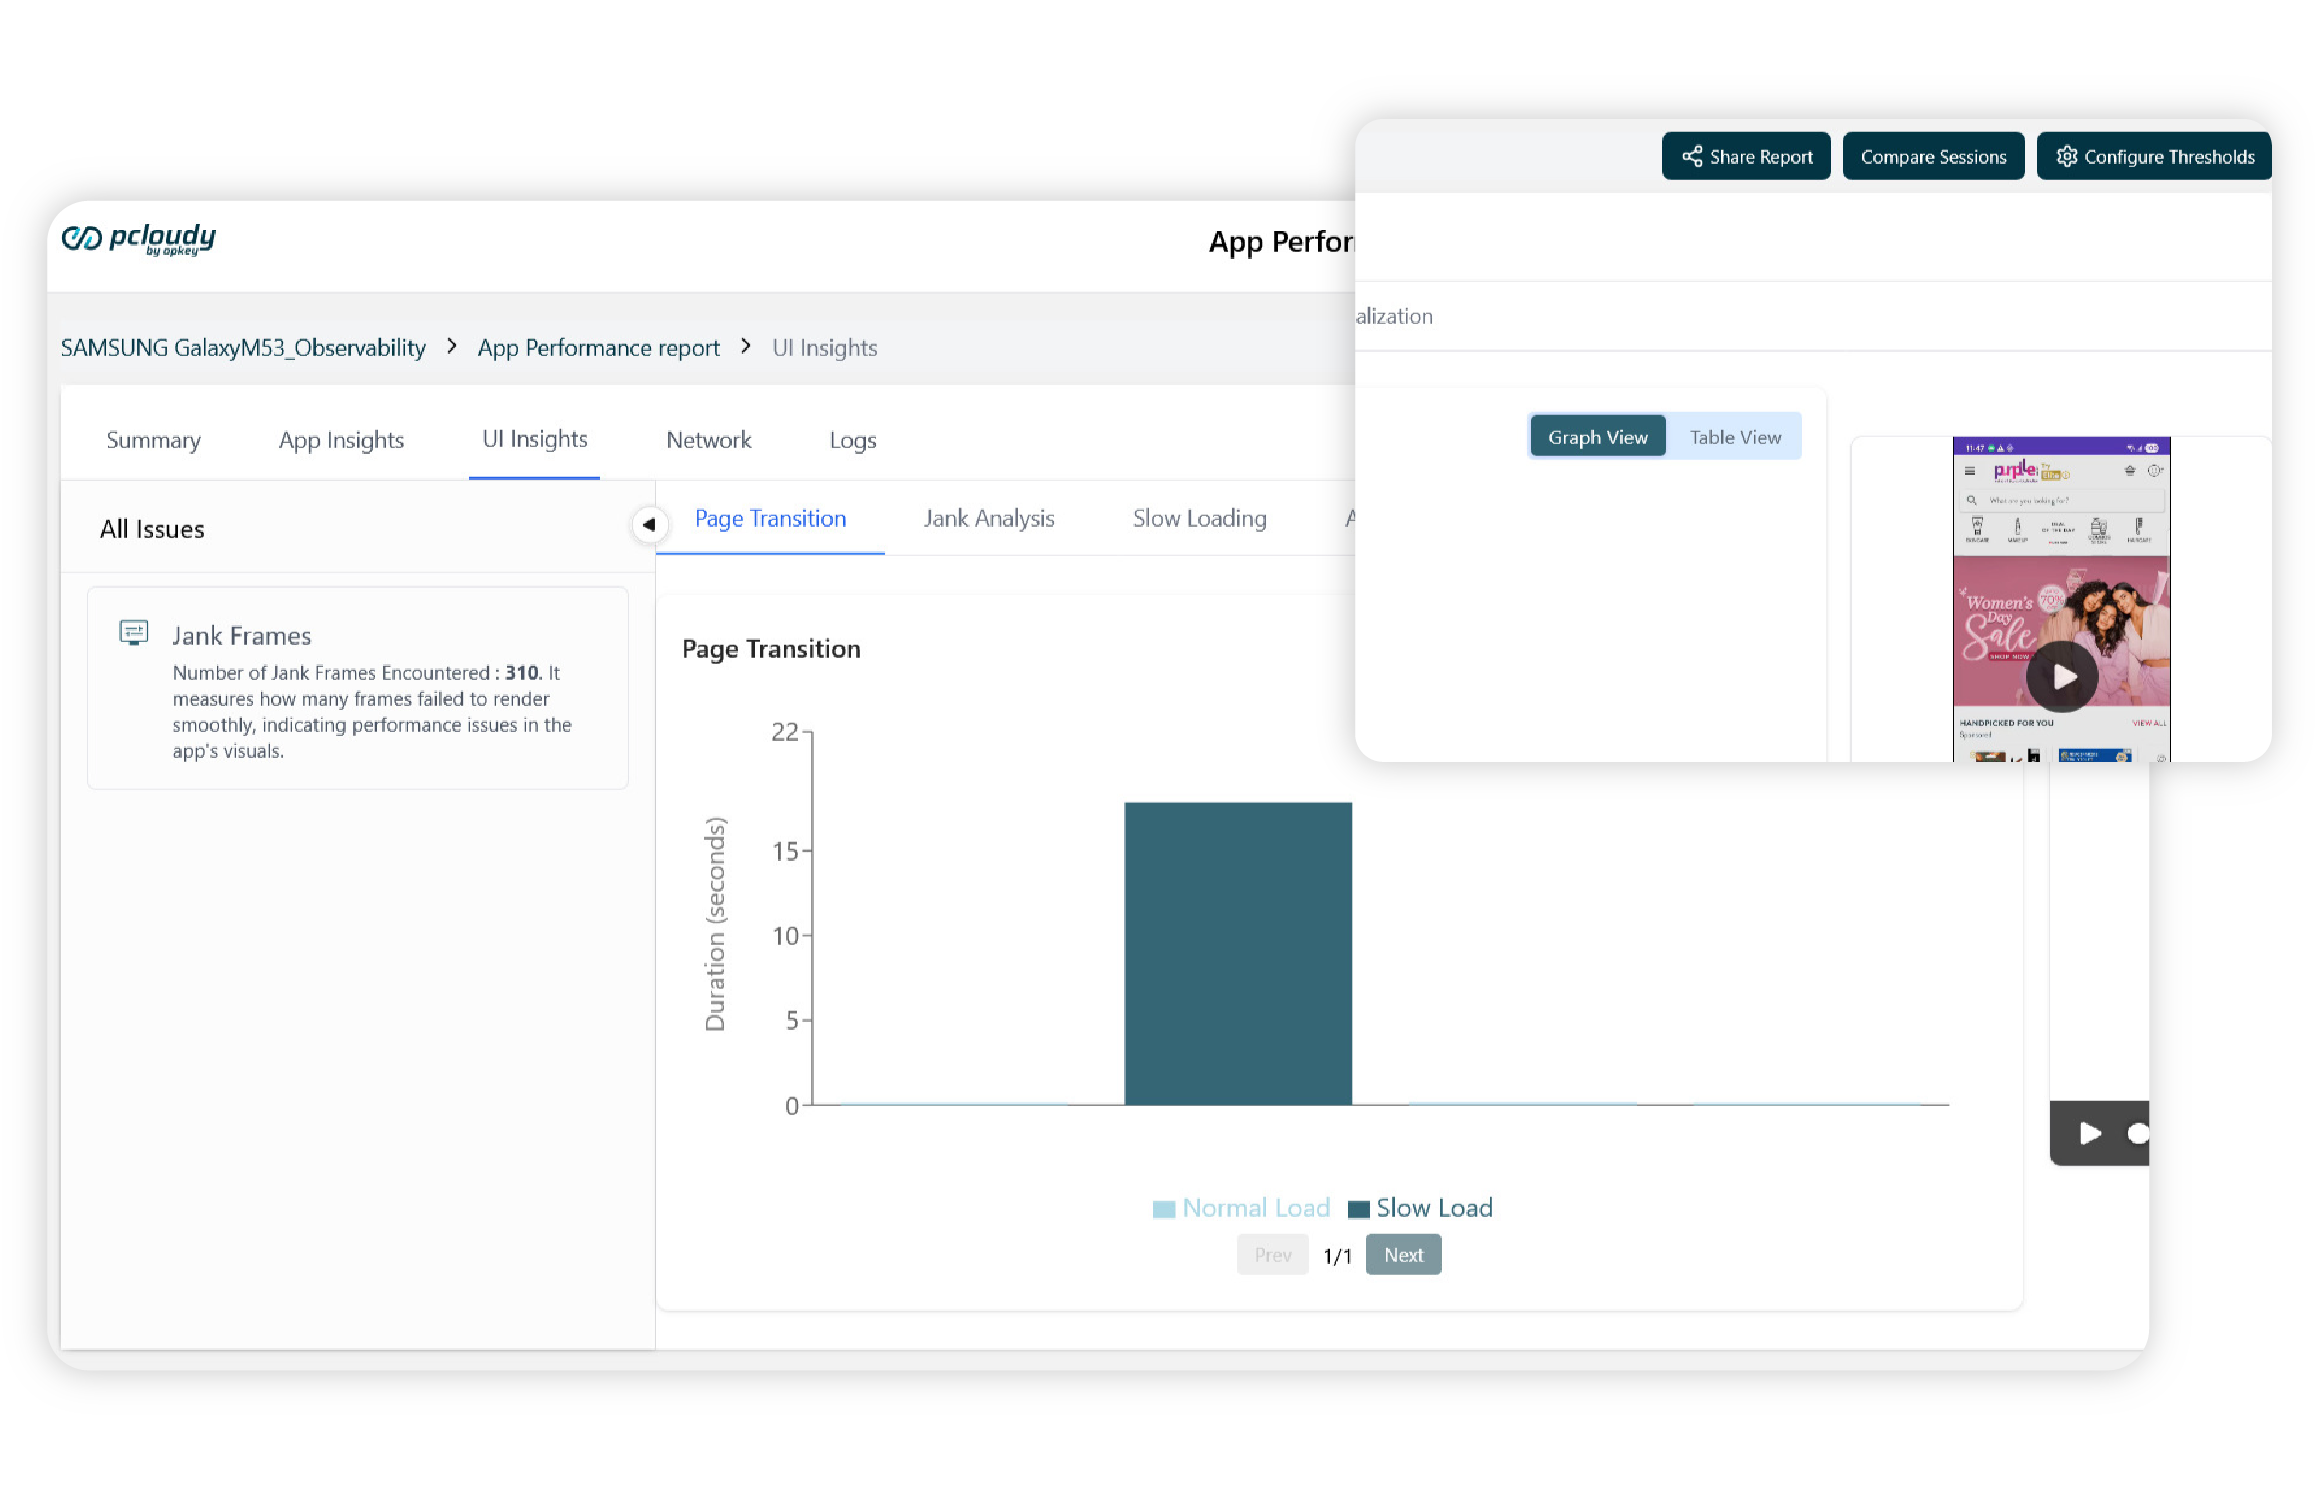
UI Insights now includes a powerful Page Transition section that provides a detailed breakdown of every screen transition captured during an App Performance session.
The feature tracks page labels, transition timing, load duration, and loading status. This helps teams quickly identify screens that load slowly or cause performance bottlenecks. The data can be explored using both Table View and Graph View to provide different perspectives on application behavior.
Key Highlights
- Detailed breakdown of screen transitions
- Identify slow-loading pages instantly
- Analyze load duration and transition timing
- Visualize results through Table and Graph views
New Device Additions
- iPhone 17
- Samsung S26
For any further assistance, you can contact our technical support team.
Did this page help you?